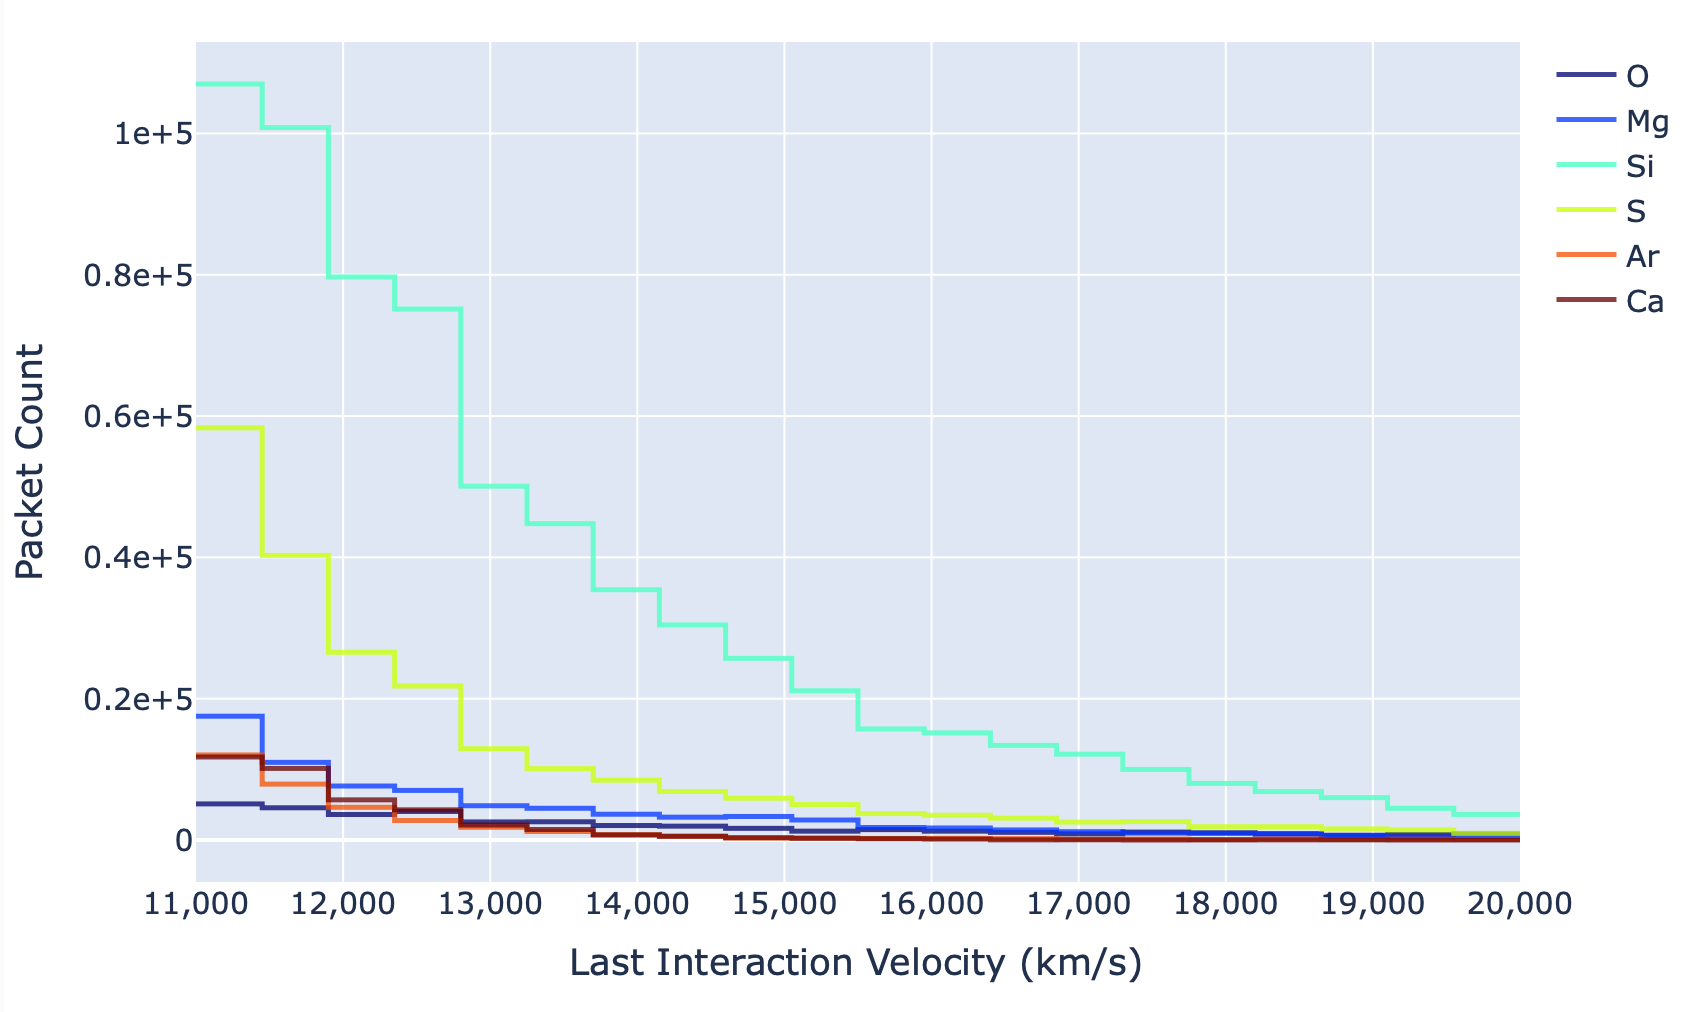
The TARDIS SDEC plot visualizes which atoms photon packets interact with before they escape the ejecta and contribute to the output spectrum’s absorption and emission features. However, the SDEC plot does not visualize where these interactions occur within the ejecta. This information can be beneficial to astronomers who want to understand which regions of the ejecta are responsible for important features in the output spectrum.
This project develops the LIV (Last Interaction Velocity) Plot that plots the number of photon packet interactions as a velocity function for each element present in the ejecta. One such example is shown in the plot below.

We can create a highly informative and visually appealing Last Interaction Velocity plot using Matplotlib, If you’re using the Last Interaction Velocity plot for exploration, consider creating an interactive version with Plotly. This allows you to zoom, pan, and inspect data values by hovering, resizing the scale, and more conveniently.

The plots have various options providing the users with more control over how your last interaction velocity looks, like, ‘species_list’, ’nelements’, ‘packet_wvl_range’, ’num_bins’, ’log_scale’ and many other options.
The detailed report for the GSoC project is available here.

