Table of Contents
Astronomy and Astrophysics Background:
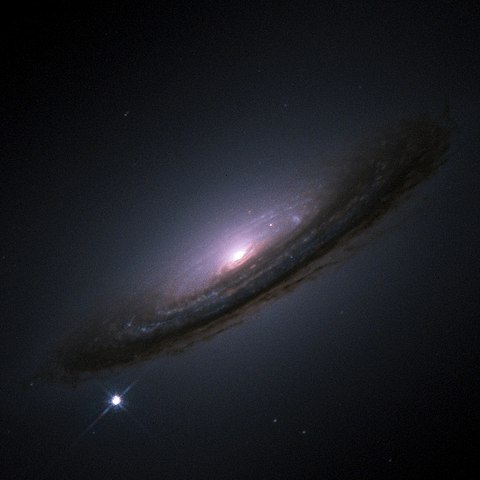
A supernova(here we show SN1994D in the Galaxy NGC4526 - image source: wikipedia) marks the brilliant death throes of a star, during which it outshines its entire galaxy. It not only marks death, though: supernova ejecta change the evolution of the universe and enable the formation of planets and life as we know it. From the iron in your blood to the silicon in your laptop, supernovae return heavy elements assembled from the primordial hydrogen and helium left after the big bang.
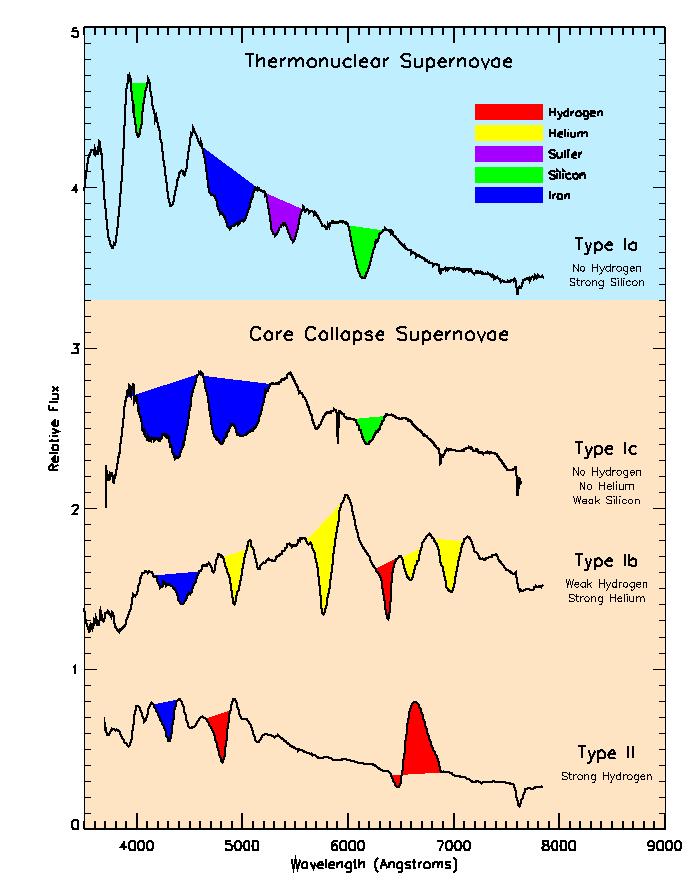
 There are still many mysteries surrounding supernovae (e.g. their precise origins, inner workings, …). One way to study these objects in more detail is to split the light coming from these objects into its components (like using a prism) and analyzing the resulting data (which is called a spectrum). Here, we show spectra (black lines) of a number of different supernova types (image courtesy Daniel Kasen and LBL). Different chemical elements present in the supernova leave their mark on the spectra by imprinting characteristic features, so-called atomic lines (regions highlighted in colour). Thus, studying and interpreting such spectra allows us to identify what supernovae are made of.
With sophisticated computer simulations astronomers try to reproduce the observed spectra to draw conclusion about the properties of the supernova ejecta and ultimately the explosion mechanism and progenitor stars. TARDIS is such a numerical code. It calculates theoretical spectra based on a number of input parameters, such as the supernova brightness and the abundances of the different chemical elements present in the ejecta (e.g. Oxygen, Silicon, Iron, etc.). The main idea for this procedure is that by finding a close match between theoretical and observed spectra we identify the parameters that actually describe the supernovae.
The TARDIS Project
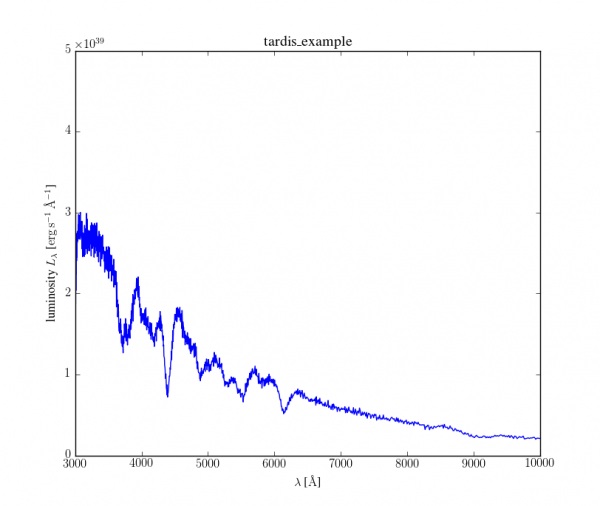
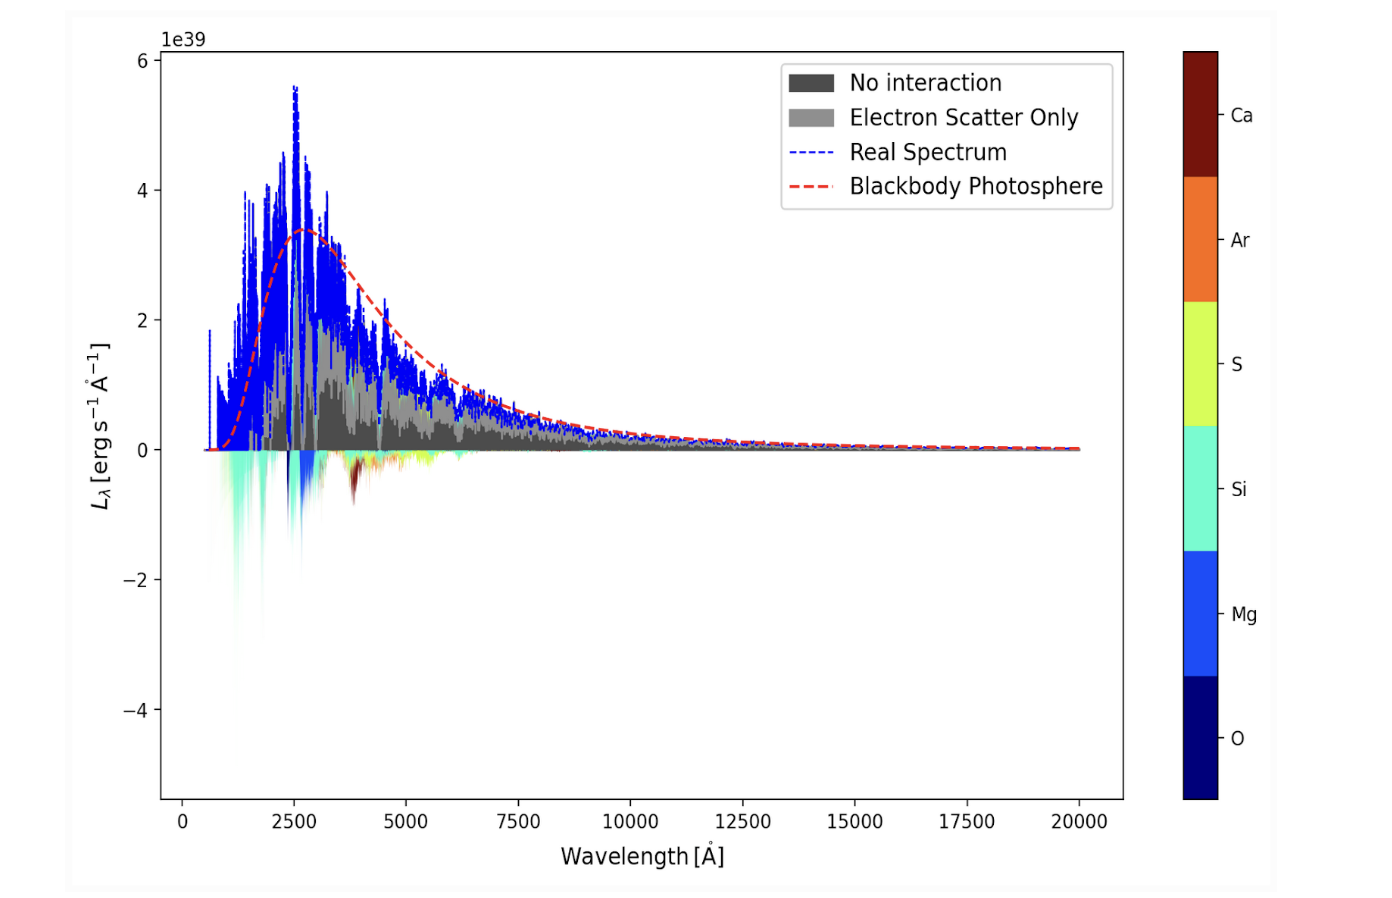
As mentioned in the background information above, TARDIS is a scientific tool (more specifically a Monte Carlo radiative transfer code) whose primary goal is the calculation of theoretical spectra for supernovae. Below, you find the typical result of a TARDIS calculation. It shows the calculated synthetic spectra for a simple supernova model. This particular setup (tardis_example) is officially provided by the TARDIS collaboration on the documentation.
List of GSoC 2026 Project Ideas
In the TARDIS collaboration we first establish a detailed plan on implementing new features before starting the actual work. This is an important step that ensures that the entire TARDIS collaboration is informed about the development efforts and that the team members can help shape the ideas during the discussion phase. We call these documents TEP - TARDIS Enhancement Proposals. We already have a great list of ideas here that we need help with. Some of these we have specially selected for GSoC 2026 and are listed with specific “warm-up” tasks below. But feel free to propose your own TEP and make a PR on that.
If you use one of our TEPs, you can definitely add more detail to the implementation, but what we really want to see is a detailed timeline with milestones that shows us that you have thought about how to implement the feature in three months. For any questions about the projects, please ask on Gitter.
Putting in a Pull Request with the First objective is essential for each proposal to allow to see how you work.
NOTE: Please also read our AI and LLM Usage Policy .
Rewrite the Custom Abundance Widget in Panel
Project Length: 350 Hours
Difficulty: Hard
Mentors: Andrew Fullard, Atharva Arya, James Gillanders, Jaladh Singhal
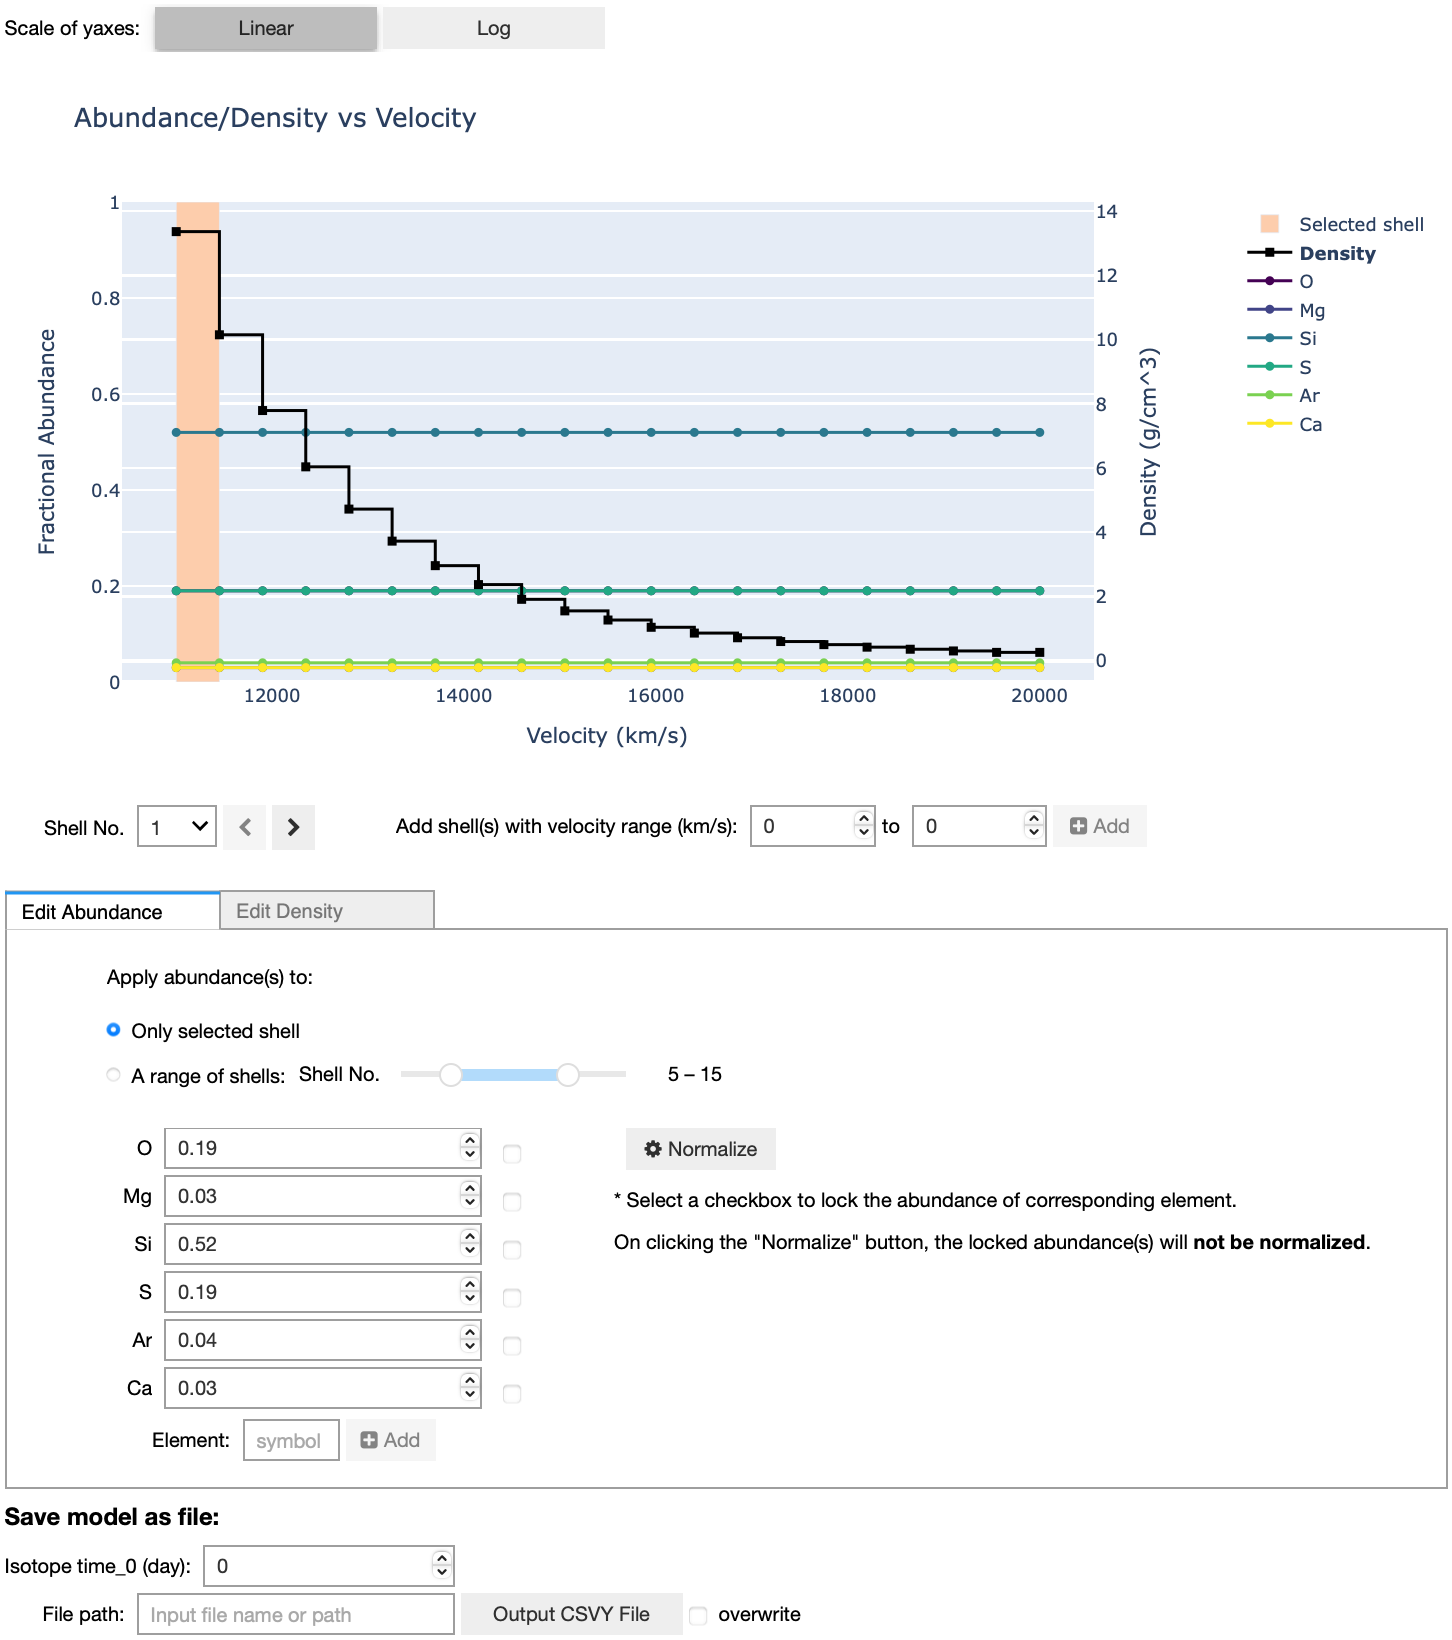
Description: TARDIS has a collection of visualisation tools and widgets to interactively explore TARDIS simulations which run inside Jupyter Notebooks. A lot of these modules currently depend on dependencies like ipywidgets which do not work well with our Sphinx documentation. Some of these tools have already been migrated but we want to migrate the rest of our widgets to panel too. For this project, you will be working on migrating the custom abundance widget to Panel.
Visualisation Module: https://tardis-sn.github.io/tardis/analyzing_tardis/visualization/index.html#tardis-widgets-graphical-user-interfaces
First Objective: The line info and shell info widgets are already migrated to panel but they are not fully interactive on the documentation. For instance, in shell info widget, switching the first table does not switch the other ones unlike in a live notebook. As the first objective of this project, your task is to make the widget fully interactive so that the widget mimics its behaviour as if it were in a notebook. See documentation here.
Expected Outcomes:
- The custom abundance widget moved to Panel.
- Visualisation tools and widgets can be embedded on the website allowing users to interact with them.
- Comprehensive documentation and tests for all code written.
TARDIS Setups Generated Plots and Gallery
Project Length: 350 Hours
Difficulty: Medium
Mentors: Josh Shields, Andrew Fullard
Description: The TARDIS umbrella includes a repository for people to put models and simulations that have been used in scientific studies, found at tardis-setups. However, there is very little ability for people to look at what is there, or glean information from the TARDIS models that would be produced by the inputs that live in the repository. This project proposes to develop a template notebook that would be run with every set of TARDIS inputs in the TARDIS setups repository. This notebook would provide a brief overview of the inputs used to generate TARDIS spectra, and an analysis visualization output generated with those TARDIS inputs. This would allow for a quick glimpse into which models exist in the repository, and could also serve as a jumping off point for people who want to create new models, since they will have access to a suite of verified working TARDIS inputs and simulations.
This project could be extended to include a web development component, where the notebook described in the last paragraph could be displayed for each set of inputs that exist in TARDIS setups, and could be easily browsed. This would also include either a pipeline for new submissions to the TARDIS setups repository to automatically produce new notebooks as well.
First Objective: Begin by making a notebook that produces a simulation with the inputs in our quickstart notebook, which can be found high up in our documentation page. Then, create a “SDec plot” and a “LIV plot” with those simulation inputs. Once you know how to do this, create a standalone script that produces those two plots and saves them to pdf or png, accepting a yml and atomic data file as inputs to your script. Validate your script by trying it out with different TARDIS .yml inputs found in the TARDIS setups repository.
Expected Outcomes:
- Visualization notebook that demonstrates a run of TARDIS, as well as the various analysis tools TARDIS offers.
- A revamping of the TARDIS setups repository to accommodate generating the notebook with the models that exist in the TARDIS setups repository.
- An easy to use pipeline that runs for new submissions to the TARDIS setups repository.
Continuum Opacity Source Reader
Project Length: 350 Hours
Difficulty: Medium
Mentors: Andrew Fullard, Josh Shields
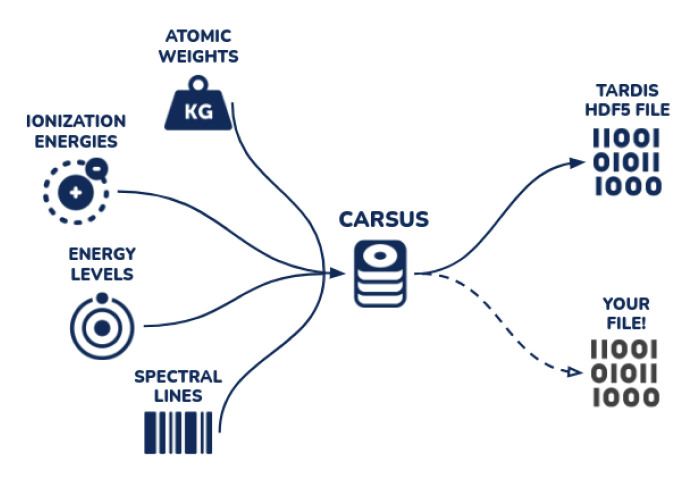
Description: There’s a lot of literature with useful tables for the TARDIS codebase and other scientific codes in pdfs (e.g. this paper), or often in dataproducts. Carsus currently reads in data from standard sources and archives (Chianti, CMFGEN), but does not flexibly read data from sources in the literature. The goal of this project is to expand Carsus to read datatables like ones in this work, with potential expansion for a future-proof workflow (new opacity tables). These could all go in a new tardis repository called “carsus-literature-tables” or something along those lines. You can look at carsus-data-molecules-barklem2016 for a preprocessed datatables ready to be ingested by Carsus might look.
First Objective: Read one of the datatables from this archive (try s92.201.gz, under ftp) and process it into a pandas dataframe. Look to do this in a programmatic way that could be reused for similar files, like the other tables found here. See section 6.4 of this paper for more details on table contents and formatting if desired.
Expected Outcomes:
- Code that reads in the new dataproducts and integrates with Carsus.
- Comprehensive documentation and tests for all code written.
Benchmark Optimisation
Project Length: 350 Hours
Difficulty: Hard
Mentors: Andrew Fullard, Atharva Arya
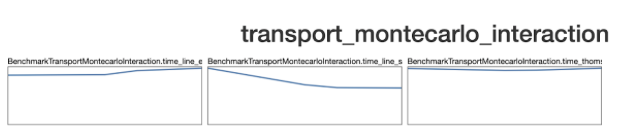
Description: TARDIS commits are monitored by a benchmarking framework to detect performance regressions. But the current framework only tests 5 commits at a time and not with much detail. The goal of this project is to improve the benchmarking framework by adding more benchmarks. This project will also add more benchmarks to STARDIS, a related code. The second stage of the project will use the benchmarks to investigate possible performance improvements to TARDIS and STARDIS.
TARDIS Benchmarks | STARDIS Benchmarks
First Objective: Benchmark the Plasma solver factory: base.py and share the ASV results for the last 5 commits along with the code in a pull request.
Expected Outcomes:
- Exhaustive benchmarks that time important TARDIS modules like plasma, transport, visualisation to name a few.
- Larger history of benchmarks (currently only 5) and regenerating benchmarks for failed commits to avoid losing benchmark history.
- Comprehensive documentation and tests for all code written.
Improving Test Coverage for Plasma Module
Project Length: 350 Hours
Difficulty: Medium
Mentors: Andrew Fullard, Atharva Arya, Josh Shields
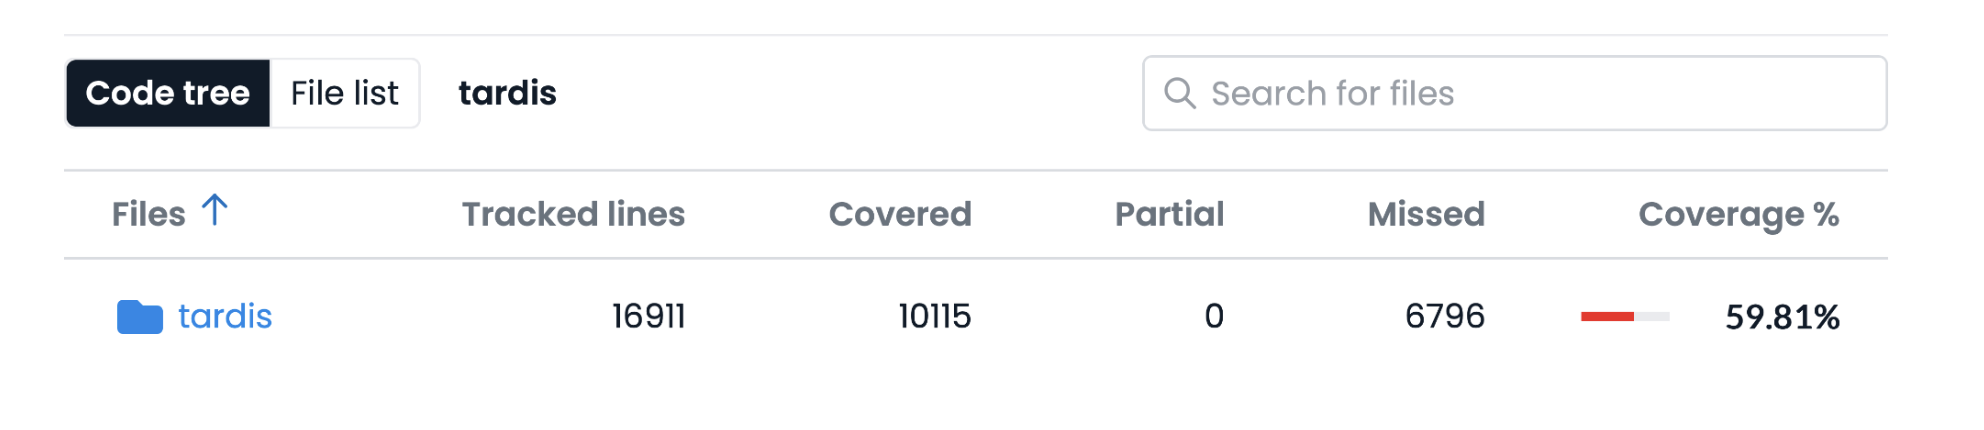
Description: TARDIS has an extensive test suite, but automated test coverage metrics (i.e., CodeCov) do not accurately report coverage of the TARDIS Plasma due to the details of its implementation. The goal of this project is to comprehensively test the plasma by making tests that are easy to find and test each part of the plasma respectively. Additionally, several parts of the module are indirectly tested using the regression data and are missing focussed tests. This makes debugging harder during failures since its hard to pin point the root cause of the failures in multiple tests. The project will begin by taking inventory of which parts of the plasma have existing tests and which do not. The student will then fill in the gaps in the plasma test coverage. Along the way, the student will learn various details of plasma physics and testing infrastructure in a large scientific codebase.
First Objective: For both objectives, indicate why that is a good test. BONUS - write in the PR description what other tests you would test.
Level 1: The DilutePlanckianRadiationField class is tested in various places indirectly via the regression tests but no direct test exists. Write a test for this class using regression data. For first objective purposes, modify the path of the regression data so that you don’t need to open a pull request in the regression data repository too.
Level 2: Write tests for the RadiativeRatesSolver class, using the regression data as in Level 1. Modify the path of the regression data similarly.
Expected Outcomes:
- Comprehensive test coverage for the plasma module.
Visualizing Packet History with Sankey Diagram
Project Length: 350 Hours
Difficulty: Medium
Mentors: Connor McClellan, Jaladh Singhal, Jared Goldberg
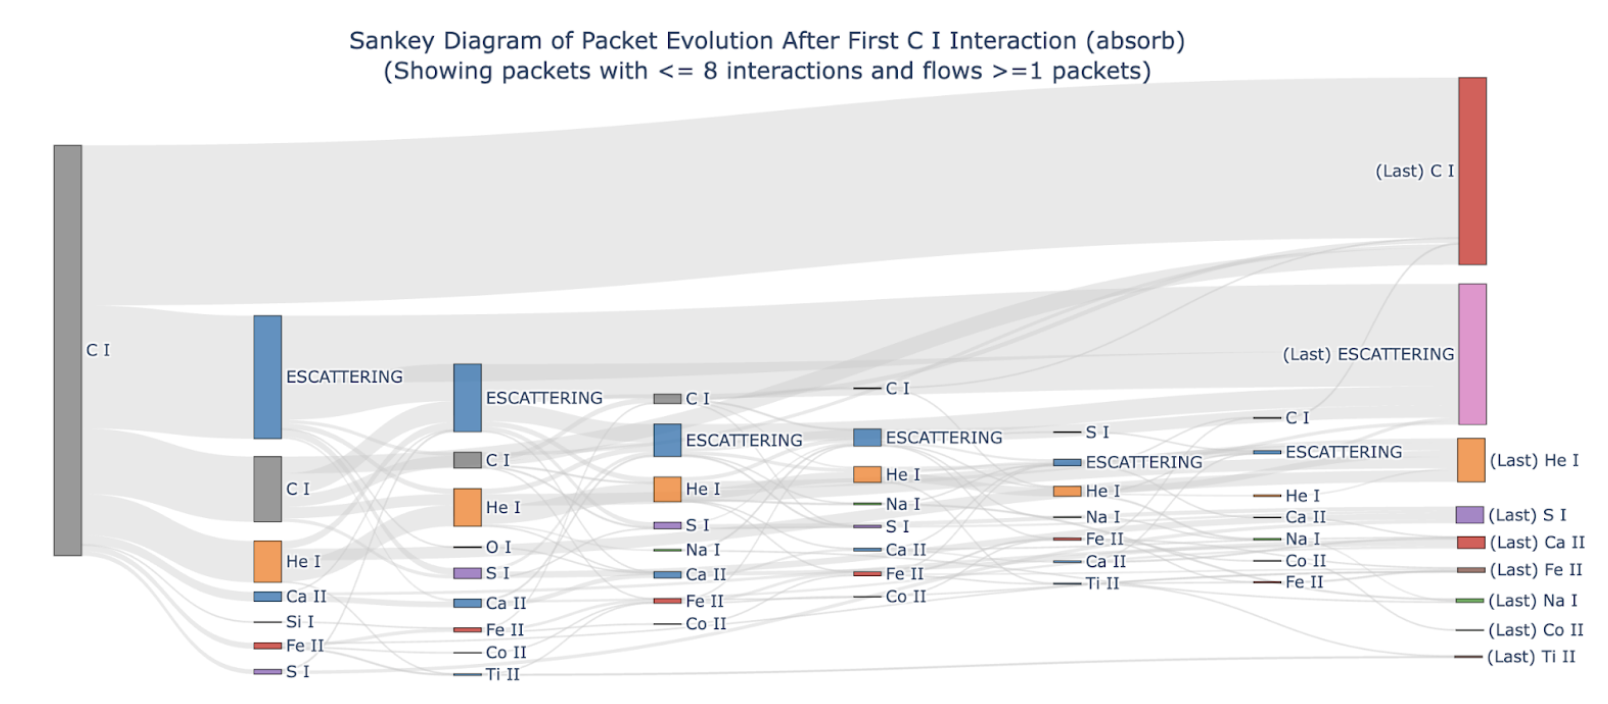
Description: A TARDIS simulation propagates a large number of Monte Carlo packets throughout the simulation domain and the last packets form the output synthetic spectrum. There is a collection of existing visualization tools that help researchers analyze the packet information, especially the last interaction. However, there are no tools/widgets to visualize the full packet history from the start to end yet. The goal of this project is to build a widget to visualize the full packet interaction history using a Sankey Diagram. The full packet history is stored within the workflow.transport_state.tracker_full_df dataframe if the setting config.montecarlo.tracking.track_rpacket is set to True.
First Objective: Extract a single packet’s interaction history from the full tracker dataframe and filter out “boundary” interactions. Try to find a packet that has a few different types of physical interactions before it escapes. Print out a list of interactions or create a simple plot showing this single packet’s interaction history.
Expected Outcomes:
- Parametrize the plotter to customise it, such as select a specific starting/end condition and/or a subset of interaction types (e.g., electron scattering, specific line interactions).
- Visualization tool that’s documented and tested similar to SDEC plot and other existing visualization tools.
Standardizing Test Tolerances
Project Length: 350 Hours
Difficulty: Medium
Mentors: Andrew Fullard, Atharva Arya, Josh Shields
Description: The TARDIS test suite verifies accuracy of the codebase using data files stored in the regression data repository. However, the tolerance levels at which data is compared is different across different parts of the code. The goal of this project is to standardize test tolerances for each test function or module, taking into account numerical differences between the different platforms for which TARDIS is developed (Mac versus Linux, for example). Since these tolerances vary based on the module due to the intricacies of the codebase, you will also have to find out which parts of the code cause these levels to rise.
For instance, test_sdec_plot.py has its tolerance level set.
First Objective: Find the tolerance levels of tests of TestBlackBodySimpleSource class and make a pull request.
Expected Outcomes:
- Known causes for different tolerance levels in different parts of the code.
- All test assertions with set tolerance levels.