Velocity Packet Tracker Visualisation
Python
GitHub
Matplotlib
Plotly
Project Length: 175 Hours
Difficulty: Moderate
Mentors: Atharva Arya, Lindsey Kwok, Marc Williamson, Mark Magee
Description: The TARDIS SDEC plot visualises which atoms photon packets interact with before they escape the ejecta and contribute towards the absorption and emission features of the output spectrum. However, the SDEC plot does not visualise where these interactions occur within the ejecta. This information can be extremely useful to astronomers who want to understand which regions of the ejecta are responsible for important features in the output spectrum. This project will develop a visualisation tool that plots the number of photon packet interactions as a function of velocity for each element present in the ejecta. See this pull request
for an example of what the plot could look like.
Your first objective if you choose to accept the mission: Run the TARDIS example simulation and generate an SDEC plot. Make a second plot showing the abundance of each element as a function of velocity.
Grotrian diagram visualisation
Python
GitHub
Matplotlib
Plotly
Basic atomic physics
Project Length: 350 Hours
Difficulty: Moderate
Mentors: Andreas Flörs, Aoife Boyle, James Gillanders, Mark Magee, Sona Chitchyan, Yuki Matsumura
Description: TARDIS generates synthetic observations of stellar explosions that can be compared to real observations. With such comparisons, we can learn more about the physical processes occurring and the conditions inside the supernova, including which elements and atomic transitions are dominant. TARDIS tracks the atomic transitions of interacting photons, level populations, etc. allowing the user to interrogate the physical conditions of the supernova. The goal of this project is to build a visual tool to represent this information for the user in Grotrian diagrams, which show different atomic levels of ions and transitions between them. An example is shown here from Boyle et al. 2017. Developing this tool will allow the user to more easily understand the important physical conditions of their supernova model.
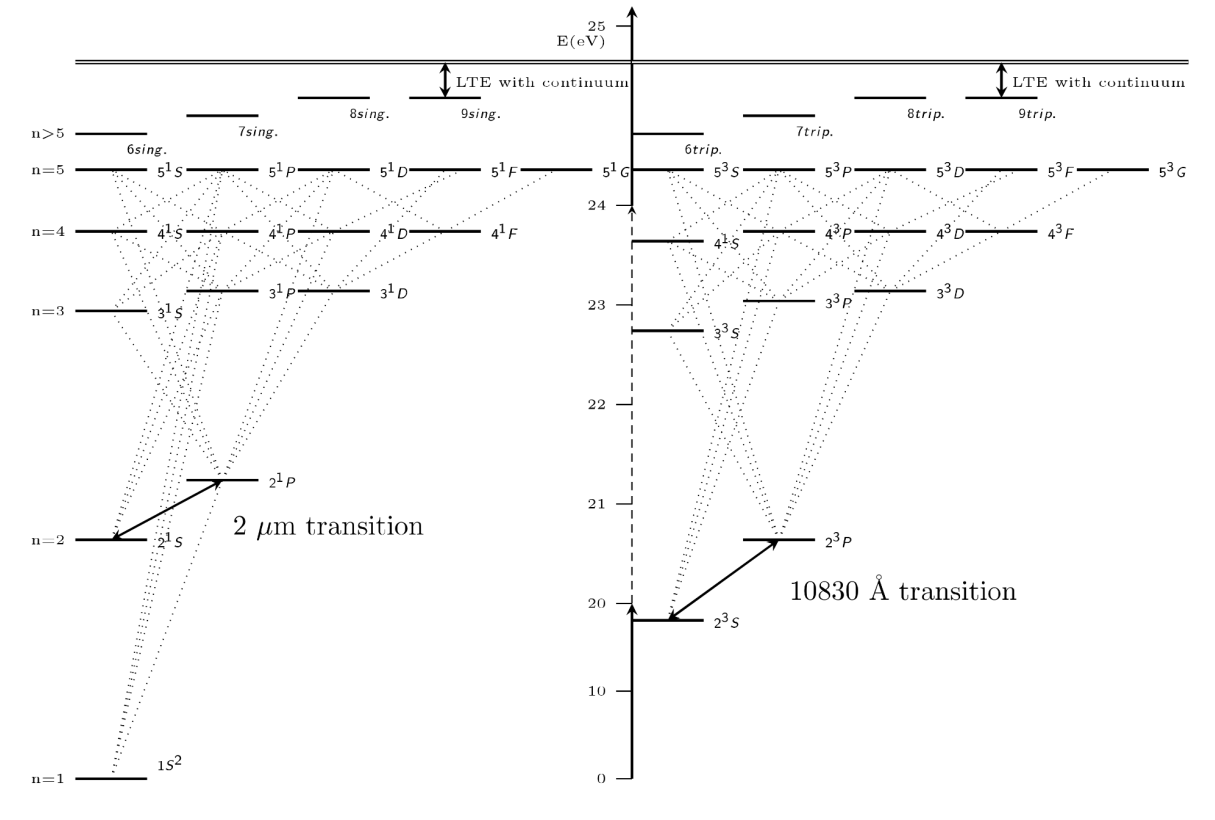 Your first objective if you choose to accept the mission: Run a TARDIS simulation and plot the fraction of neutral and singly-ionised silicon against velocity.
Develop an interactive abundance visualisation tool
Python
GitHub
Matplotlib
Plotly
Project Length: 175 Hours
Mentors: Atharva Arya, Eva Laplace, Harshul Gupta, James Gillanders
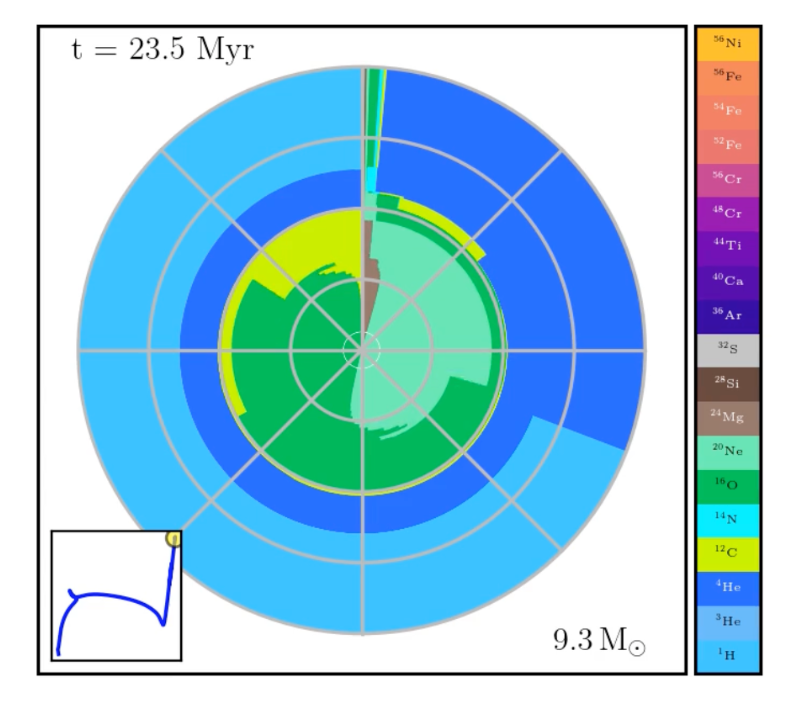
Description: TARDIS is used to model and understand the properties of the material ejected during violent explosions in space. By specifying some input model parameters, the simulation runs and generates synthetic spectra which can be compared to observations. Currently, some of the model properties can be difficult to interpret, and so we envisage developing some helpful visualisation tools to aid in understanding the properties of the input model. Specifically, we hope to develop an interactive widget that illustrates the composition of the ejected material across the velocity of the simulation. The focus of this project would be developing a TARDIS plot that is inspired by the TULIPS visualisation tools (see https://astro-tulips.readthedocs.io/en/latest/chemical_profile_diagram.html
).
First objective: Run the TARDIS example simulation and plot the abundance of the elements against velocity.
Inner boundary velocity solver
Python
GitHub
NumPy
Pandas
Astrophysics
Project Length: 350 Hours
Mentors: Andreas Flörs, Christian Vogl, Jack O’Brien
Description: TARDIS operates on a “photospheric” inner boundary approximation. A hard inner boundary in velocity is set from which radiative packets are emitted through the ejecta according to a black-body distribution at a given temperature. Currently, TARDIS can solve for the radiative and inner boundary temperatures as well as dilution factors given a static inner velocity boundary. The precise location of where this inner boundary velocity should be placed is not always obvious and there are a few methods by which one can intelligently select a location based on the properties of the plasma (which are constantly updating over each iteration). We would like to be able to update the location of the inner boundary velocity at each iteration based on a set of options for desired properties of the plasma at each iteration so that the inner boundary velocity does not have to be set by hand. The options include setting the inner boundary velocity according to a given optical depth over all frequencies (either Planck or Rossland mean opacities) or setting the inner boundary according to a desired value for the dilution factors. Some work must be done to handle these updates mid iteration as the updated velocity boundary may, for example, move outside the bounds of the simulation or may move between simulation shells.
First objective: Find the best inner boundary velocity value for the three tardis models found here
. For each model, run them through tardis and look at the converged value of the dilution factor (w) at the innermost shell (shell 0) after the final iteration. Edit the configuration files to adjust the inner boundary velocity appropriately in order to try to make the inner shell dilution factor be equal to 0.5. Run the simulation again with your updated inner boundary velocity and again check the dilution factor at the end of the simulation. Once again adjust the inner boundary velocity to try to make the dilution factor closer to the desired value. Repeat this process for each model until the final dilution factor at the innermost shell is equal to 0.5 to within an accuracy of 0.01. In a jupyter notebook, create a cell in markdown that explains the process you went through to find the best value for the inner boundary velocity. If you automated this process, describe how you did it and include the relevant code in a cell below the explaination. In this notebook, for each model, include a cell that plots the integrated spectrum of the simulation using the original inner boundary velocity and using the inner boundary velocity that you found. Both spectra should be on the same plot. The plot should include axis labels, a title that uniquely identifies the model you are plotting, and a legend that indentifies which spectrum is which including the value of each spectrum’s respective inner boundary velocity and innermost converged dilution factor. The resulting notebook should then contain 3 plots (corresponding to each model) with two spectra on each plot (corresponding to the spectrum before and after you have updated the inner bounardary velocity).
STARDIS Parallelization and GPU
Python
GitHub
Numba
Cuda
Project Length: 350 Hours
Mentors: Alexander Holas, Atharva Arya, Isaac Smith, Jaladh Singhal, Vicente Amado Olivo
Description: STARDIS generates synthetic spectra for stars, given a set of parameters. These spectra can then be compared to real observations to give us information about the conditions inside that star’s atmosphere. STARDIS is a new companion code to TARDIS, and has not yet been optimised. The goal of this project is to increase the speed of STARDIS using Numba
by allowing slower parts of STARDIS to be run in parallel
, and allowing for them to be run on the GPU using Numba’s CUDA capabilities
. As a reference, this has been done in TARDIS with the formal integral. The regular Numba version (with parts parallelized) can be found here
. Then, there is also a version written with CUDA here
. Increasing the speed of STARDIS will allow research to be done rapidly using our tools.
First objective: In the TARDIS repository, find the Jupyter Notebook that creates the initialization page of the documentation
. Create a version of planck_function() (see code cell #6) that is jit compiled by Numba. Show a comparison of how long it takes to calculate planck_function(nus_planck) (see code cell #7) for the original function versus the jitted function for 100, 200, and 500 frequency bins. Make a pull request to the TARDIS repository with your modifications of this notebook.
Connecting the Gamma-ray code to TARDIS
Python
GitHub
Object Oriented Programming
Project Length: 350 Hours
Mentors: Andrew Fullard, Vicente Amado Olivo
Description: A gamma-ray transport code
has been developed to make use of the TARDIS infrastructure. However, the gamma-ray transport code is disconnected from the way TARDIS is run to generate normal spectra (see the Quickstart
). It is not connected with the rest of the API. Instead it uses the Radial1Dmodel
object by loading from a configuration file, and generates a plasma
object from scratch, as well as loading external data. When it runs, it duplicates some functionality that is already in TARDIS as part of the Monte Carlo modules
. It also lacks tests of many new functions. For this project, you will integrate the gamma-ray transport code with the rest of TARDIS so that it is an option to run as part of a normal TARDIS simulation.
First objective: In a notebook, generate a configuration object from the tardis_example.yml. Then use the configuration object to generate a Radial1DModel object using the from_config method. The configuration object’s atom_data property should also be used to create an AtomData object using the from_hdf method. Then use the Radial1DModel object to generate a BasePlasma object. The BasePlasma plasma_properties should be a list of properties: [Density, Abundance, IsotopeAbundance, AtomicData, AtomicMass, IsotopeNumberDensity, NumberDensity, SelectedAtoms, IsotopeMass]. The density, abundance, isotope_abundance should be read from the model object. The atomic_data should be the AtomData object created previously. Finally, run the main_gamma_ray_loop function using these created model and plasma objects. You will get an error from Pandas that a file is not found.
Import and store NNDC deposition data
Python
GitHub
Pandas
Project Length: 175 Hours
Mentors: Andreas Flörs, Andrew Fullard, Jack O’Brien
Description: Carsus currently stores atomic transition data. TARDIS has a new module that transports gamma-rays that are created by nuclear decay. Nuclear decay data are stored by the NNDC in a format that is difficult to read and compile called ENSDF. The NNDC also provides a parser for this data online called “radlist”. This project will use the ENSDF archives from NNDC and the parser to download, process, and store nuclear decay data for all available isotopes in the Carsus HDF output.
First objective: In a jupyter notebook, use the requests.post function of Python to download the result as a json from this page
. You should pass in an ENSDF file and the requested format into the data dictionary. You can acquire an ENSDF file from this page
by entering “Co56” (Cobalt 56) into the Nucleus input field.
Simulation Object Restructure
Python
GitHub
Project Length: 175 Hours
Mentors: Atharva Arya, Jack O’Brien, Sona Chitchyan
Description: When running TARDIS, an instance of the Simulation object
is called first. It sets up the model of the simulation, including initial luminosity, inner temperature of the photosphere, etc. The Simulation class also consists of visualisation tools like convergence plots
and progress bars
which update in real time, displaying various scientific variables and make it easier for users to understand the status of the convergence of the simulation. All of those methods are essential for the simulation to be able to run, but having them all in one class makes it hard for developers to maintain the code and incorporate newer features. This project aims to break the Simulation Object into smaller and more compact classes, making it more modular and maintainable. There will also be a need to restructure the tests to check the functionality of the added features.
First objective: The first objective is creating a new class called ConvergencePlot and move damped_converge and _get_convergence_status methods into this new class. Make sure that you can successfully run an example TARDIS simulation with this change. Make a PR on TARDIS with your change.
Having versioned atomic data repositories
Python
GitHub
Project Length: 175 Hours
Mentors: Atharva Arya, Ezequiel Passaro, Issac Smith, Josh Shields, Wolfgang Kerzendorf
Description: Carsus generates an HDF file by combining atom data from various sources(CMFGEN, Chianti, NIST, to name a few). This HDF file is then used by TARDIS to generate the atomic spectra. When a new version of the atomic source rolls out, we don’t have a way to determine what changes have crept in. In this project you’d be asked to create a GitHub repository and determine a way to check when a new version of the atomic data source is available and its comparison to the previous versions. Carsus should then use this latest version to generate its atomic file.
First objective: Run the Carsus Quickstart with two different versions of Chianti and compare the generated atomic files using the Atom Data Comparison notebook.