STARDIS
Import Necessary Code
[ ]:
import numpy as np
import matplotlib.pyplot as plt

from tardis.io.atom_data.util import download_atom_data

from stardis.base import run_stardis

from astropy import units as u
Download Atomic Data
[3]:
download_atom_data('kurucz_cd23_chianti_H_He')
Atomic Data kurucz_cd23_chianti_H_He already exists in /home/groneck/Downloads/tardis-data/kurucz_cd23_chianti_H_He.h5. Will not download - override with force_download=True.
The STARDIS Configuration
STARDIS uses YAML files for the configuration. The configuration file called stardis_example.yml used here can be found here, along with the other files used in this Quickstart notebook. Below, we present an example for instructions for customizing the configuration for your needs.
stardis_config_version: 1.0
atom_data: <filepath to atomic data file>
input_model:
    type: marcs # more options will be available in the future
    fname: <filepath to model file>
    final_atomic_number: <atomic number of largest element considered>
opacity:
    file: # reads a bound-free or free-free opacity file, omit if none
        <species1>_<either bf for bound-free or ff for free-free>: <filepath to opacity file>
        <species2>_<either bf for bound-free or ff for free-free>: <filepath to opacity file>
        ...
    bf: # uses the hydrogenic approximation for bound-free opacity, omit if none
        <species1>: {} # there will eventually be options to include files with gaunt factors or departure coefficients
        <species2>: {}
        ...
    ff: # uses the hydrogenic approximation for free-free opacity, omit if none
        <species1>: {} # there will eventually be options to include files with gaunt factors or departure coefficients
        <species2>: {}
        ...
    rayleigh: <list of species considered for rayleigh scattering> # may include H, He, and/or H2, omit or use [] for none
    disable_electron_scattering: <True or False>
    line: # settings for line interaction opacity, at least one subfield is required
        disable: <True or False>
        broadening: <list of non-thermal broadening sources considered> # may include radiation, linear_stark, quadratic_stark, and/or van_der_waals, omit or use [] for none
no_of_thetas: <number of angles to sample for raytracing>
In fields where an atomic species is requested, the species must be in the form <atomic symbol>_<ionization roman numeral>. For example, H_I for neutral hydrogen, or Si_III for twice-ionized silicon.
Additionally, in the opacity file section, the following entries are valid:
Hminus_bfHminus_ffHeminus_ffH2minus_ffH2plus_ff
Opacity File Format
STARDIS can read and interpolate continuum opacity cross-section files for bound-free or free-free absorption (technically, for free-free absorption the files would provide the cross-section per electron density). The files must be one of the following formats:
wavelength_1, cross-section_1
wavelength_2, cross-section_2
wavelength_3, cross-section_3
...
or
, temperature_1, temperature_2, temperature_3, ...
wavelength_1, cross-section_11, cross-section_12, cross-section_13, ...
wavelength_2, cross-section_21, cross-section_22, cross-section_23, ...
wavelength_3, cross-section_31, cross-section_32, cross-section_33, ...
...
Note the leading comma in the latter format. Temperatures must be in Kelvin, wavelengths in Angstroms, and cross-sections in cm² for bound-free or cm⁵ for free-free (once again because free-free opacity files provide the cross-section per electron density).
Create Array of Wavelengths and Run STARDIS
The main function, run_stardis(), requires as its first argument the name of a configuration file, which will be described below. The second argument is an array of the frequencies or wavelengths for which you are requesting the flux density, times an appropriate astropy quantity (such as Hertz or Angstroms). Note that this must be an array times a quantity, not an array of astropy quantities.
[4]:
tracing_lambdas = np.mgrid[6540:6590:.01]* u.Angstrom

sim = run_stardis('stardis_example.yml', tracing_lambdas)
WARNING: UnitsWarning: 'erg/cm2/s' contains multiple slashes, which is discouraged by the FITS standard [astropy.units.format.generic]
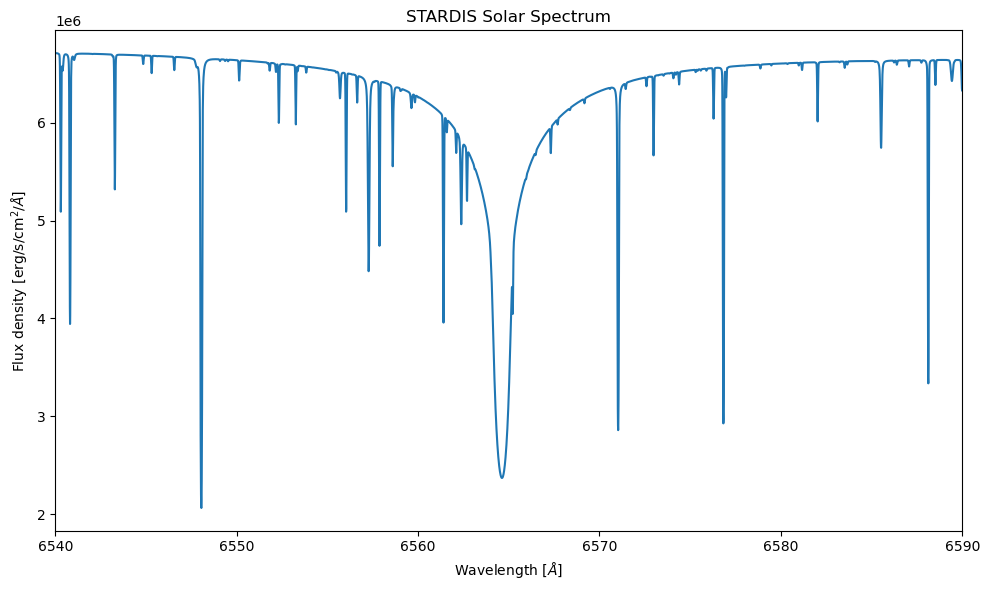
Plot spectra
[5]:
plt.figure(figsize=(10,6))
plt.plot(sim.lambdas, sim.spectrum_lambda)

plt.xlim((6540,6590))
plt.title("STARDIS Solar Spectrum")
plt.xlabel(r"Wavelength [$\AA$]")
plt.ylabel(r"Flux density [erg/s/cm$^2$/$\AA$]")
plt.tight_layout()

plt.show()
