You can interact with this notebook online: Launch notebook
Analysing Montecarlo Packets
RPacketPlotter plots the RPackets that are generated by the Montecarlo method and creates an animated plot that contains the packet trajectories as they move away from the photosphere. The properties of individual RPackets are taken from the rpacket_tracker.
RPacketPlotter uses the properties (specifically, mu and r) present in the rpacket_tracker to calculate the coordinates of packets as they move through the ejecta. In the following section, the mathematical expression for getting the angle(θ) of packets with respect to the x-axis is shown, which can be used (along with radius r) to calculate the x and y coordinates of packets.
Getting packet coordinates
RPacketPlotter uses the properties (specifically, θ and r) present in the rpacket_tracker to calculate the coordinates of packets as they move through the ejecta. In the following section, the mathematical expression for getting the angle(α) of packets with respect to the x-axis is shown, which can be used (along with radius r) to calculate the x and y coordinates of packets. 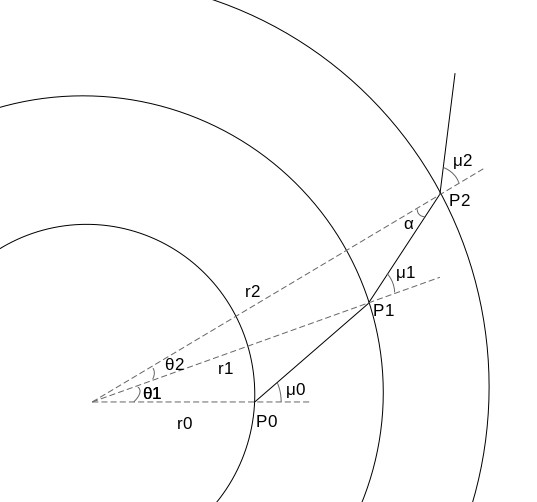
The diagram above shows the packet trajectory as it starts from photosphere P0 and continues to move along the subsequent points P1, P2, and so on.
Note
Here θ represents the direction of packet propagation with respect to the radial line.
To determine the polar coordinates of any arbitrary point, say P2, we need r2 and α2. r2 is already present in the array obtained from the simulation. To determine α2, we use the sine rule and apply it to the triangle OP1P2, where O is the center.
Now, writing α in terms of μ1 and θ2
Thus,
Hence, for i-th point, θ will be:
[1]:
import copy
import math

import astropy.units as u
import numpy as np
import plotly.graph_objects as go

from tardis.visualization import plot_util as pu
/home/runner/work/tardis/tardis/tardis/__init__.py:17: UserWarning: Astropy is already imported externally. Astropy should be imported after TARDIS.
  warnings.warn(
Initializing tabulator and plotly panel extensions for widgets to work
Every simulation run requires atomic data and a configuration file.
Atomic Data
We recommend using the kurucz_cd23_chianti_H_He_latest.h5 dataset.
[2]:
from tardis.io.atom_data import download_atom_data

# We download the atomic data needed to run the simulation
download_atom_data("kurucz_cd23_chianti_H_He_latest")
Atomic Data kurucz_cd23_chianti_H_He_latest already exists in /home/runner/Downloads/tardis-data/kurucz_cd23_chianti_H_He_latest.h5. Will not download - override with force_download=True.
Example Configuration File
[3]:
!wget -q -nc https://raw.githubusercontent.com/tardis-sn/tardis/master/docs/tardis_example.yml
[4]:
!cat tardis_example.yml
# Example YAML configuration for TARDIS
tardis_config_version: v1.0

supernova:
  luminosity_requested: 9.44 log_lsun
  time_explosion: 13 day

atom_data: kurucz_cd23_chianti_H_He_latest.h5

model:
  structure:
    type: specific
    velocity:
      start: 1.1e4 km/s
      stop: 20000 km/s
      num: 20
    density:
      type: branch85_w7

  abundances:
    type: uniform
    O: 0.19
    Mg: 0.03
    Si: 0.52
    S: 0.19
    Ar: 0.04
    Ca: 0.03

plasma:
  disable_electron_scattering: no
  ionization: lte
  excitation: lte
  radiative_rates_type: dilute-blackbody
  line_interaction_type: macroatom

montecarlo:
  seed: 23111963
  no_of_packets: 4.0e+4
  iterations: 20
  nthreads: 1

  last_no_of_packets: 1.e+5
  no_of_virtual_packets: 10

  convergence_strategy:
    type: damped
    damping_constant: 1.0
    threshold: 0.05
    fraction: 0.8
    hold_iterations: 3
    t_inner:
      damping_constant: 0.5

spectrum:
  start: 500 angstrom
  stop: 20000 angstrom
  num: 10000
[5]:
from tardis.io.configuration.config_reader import Configuration

# Reading the Configuration stored in `tardis_example.yml` into config
config = Configuration.from_yaml("tardis_example.yml")
[6]:
# changing config file for enabling the rpacket_tracking
config["montecarlo"]["tracking"]["track_rpacket"] = True
Loading Simulation Data
Running simulation
To run the simulation, import the run_tardis function and create the sim object.
Note:
Get more information about the progress bars, logging configuration, and convergence plots.
[7]:
from tardis import run_tardis

sim = run_tardis(config, show_progress_bars=False, log_level="ERROR")
Auto-detected Jupyter notebook environment
Initializing panel with ipywidgets comms for Jupyter notebook
Auto-detected Jupyter notebook environment
Initializing panel with ipywidgets comms for Jupyter notebook
Embedding the final state for Jupyter environments
HDF
TARDIS can save simulation data to HDF files for later analysis. The code below shows how to load a simulation from an HDF file. This is useful when you want to analyze simulation results without re-running the simulation.
[8]:
# import astropy.units as u
# import pandas as pd

# hdf_fpath = "add_file_path_here"
# with pd.HDFStore(hdf_fpath, "r") as hdf:
#     sim = u.Quantity(hdf["/simulation"])
Setting up Theme Colors
[9]:
theme_colors = dict(
    light=dict(
        linecolor="#555",
        gridcolor="#fafafa",
        zerolinecolor="#fafafa",
        color="#000",
        photosphere_line_color="black",
        photosphere_fillcolor="darkgrey",
        shells_line_color="black",
        packet_line_color="darkslategrey",
        plot_bgcolor="#fafafa",
        paper_bgcolor="#fafafa",
        title_font_color="#444",
        legendgrouptitle_color="#444",
        button_bgcolor="#fafafa",
        button_font_color="#2A3F5F",
        slider_font_color="#2A3F5F",
        bordercolor="#BEC8D9",
        slider_bgcolor="#F8FAFC",
        slider_activebgcolor="#DBDDE0",
        slider_currentvalue_color="#2A3F5F",
        font_color="#000",
    )
)

interaction_from_num = [
    {"text": "No Interaction", "color": "darkslategrey", "opacity": 0},
    {"text": "e-Scattering", "color": "#3366FF", "opacity": 1},
    {"text": "Line Interaction", "color": "#FF3300", "opacity": 1},
]
theme = "light"
Base templates and configurations
Button Controls
Play/Pause animation control buttons for the figure.
[10]:
BUTTONS = [
    {
        "args": [
            None,
            {
                "frame": {"duration": 500, "redraw": False},
                "fromcurrent": True,
                "transition": {
                    "duration": 300,
                    "easing": "quadratic-in-out",
                },
            },
        ],
        "label": "Play",
        "method": "animate",
    },
    {
        "args": [
            [None],
            {
                "frame": {"duration": 0, "redraw": False},
                "mode": "immediate",
                "transition": {"duration": 0},
            },
        ],
        "label": "Pause",
        "method": "animate",
    },
]
Shell Shape Template
Base shape dict used to draw ejecta shell circles.
[11]:
SHELL_CIRCLE_TEMPLATE = {
    "type": "circle",
    "xref": "x",
    "yref": "y",
    "x0": None,
    "y0": None,
    "x1": None,
    "y1": None,
}
Hover Tooltip
Tooltip content shown on packet hover.
[12]:
HOVER_TEMPLATE = (
    "<b>X</b>: %{x}<br><b>Y</b>: %{y}<br><b>Last Interaction: %{text}</b>"
)
Legend Config
Base config for a legend entry.
[13]:
BASE_LEGEND_CONFIG = dict(
    x=[9999999],
    y=[0],
    legendgroup="a",
    opacity=1,
    mode="lines+markers",
)
Slider Step
Template for each step in the animation slider.
[14]:
SLIDER_STEP_TEMPLATE = {
    "args": [
        None,
        {
            "frame": {"duration": 300, "redraw": False},
            "mode": "immediate",
            "transition": {"duration": 300},
        },
    ],
    "label": None,
    "method": "animate",
}
Slider Styling and Behavior
Full slider configuration for animation steps.
[15]:
SLIDERS_TEMPLATE = {
    "active": 0,
    "activebgcolor": theme_colors[theme]["slider_activebgcolor"],
    "bgcolor": theme_colors[theme]["slider_bgcolor"],
    "bordercolor": theme_colors[theme]["bordercolor"],
    "yanchor": "top",
    "xanchor": "left",
    "currentvalue": {
        "font": {
            "color": theme_colors[theme]["slider_currentvalue_color"],
        },
        "prefix": "Step:",
        "visible": True,
        "xanchor": "right",
    },
    "font": {"color": theme_colors[theme]["slider_font_color"]},
    "transition": {"duration": 300, "easing": "cubic-in-out"},
    "pad": {"b": 10, "t": 50},
    "len": 0.9,
    "x": 0.1,
    "y": 0,
}
Axis Styling
Base styling for x and y axis.
[16]:
BASE_AXIS_CONFIG = {
    "exponentformat": "none",
    "color": theme_colors[theme]["color"],
    "linecolor": theme_colors[theme]["linecolor"],
    "gridcolor": theme_colors[theme]["gridcolor"],
    "zerolinecolor": theme_colors[theme]["zerolinecolor"],
}
Calculating Packet Coordinates and Interactions
Setting up initial parameters for packet tracking
[17]:
no_of_packets = 20
# getting velocity of different shells
v_shells = sim.simulation_state.velocity.to_value(u.km / u.s)
r_packet_tracker = sim.transport.transport_state.rpacket_tracker_df.loc[
    0:(no_of_packets)
]
Calculating packet trajectories and interactions
[18]:
# for plotting packets at equal intervals throught the circle, we choose alphas distributed uniformly
alphas = np.linspace(0, 2 * math.pi, no_of_packets + 1)
rpackets_x = []
rpackets_y = []
rpackets_interactions = []
# getting coordinates and interaction arrays for all packets
for packet_no in range(no_of_packets):
    r_track = r_packet_tracker.loc[packet_no]["r"]
    mu_track = r_packet_tracker.loc[packet_no]["mu"]
    time = sim.simulation_state.time_explosion.value
    last_interaction_type = r_packet_tracker.loc[packet_no]["interaction_type"]
    alpha_initial = alphas[packet_no]

    (
        single_rpacket_x,
        single_rpacket_y,
        single_alpha,
        single_rpacket_interactions,
    ) = [], [], [], []

    # getting alphas at different steps of the packet movement
    for step_no in range(len(r_track)):
        # for the first step the packet is at photosphere, so alpha will be equal to the intial angle we are launching the packet from
        if step_no == 0:
            single_alpha.append(alpha_initial)
        # for further steps we calculate alphas with the formula derived in the documentation
        else:
            if r_track[step_no] < r_track[step_no - 1]:
                single_alpha.append(
                    single_alpha[-1]
                    - math.pi
                    + math.asin(
                        r_track[step_no - 1]
                        * math.sin(math.acos(mu_track[step_no - 1]))
                        / r_track[step_no]
                    )
                    + math.acos(mu_track[step_no - 1])
                )
            else:
                single_alpha.append(
                    single_alpha[-1]
                    + math.asin(
                        -1
                        * r_track[step_no - 1]
                        * math.sin(math.acos(mu_track[step_no - 1]))
                        / r_track[step_no]
                    )
                    + math.acos(mu_track[step_no - 1])
                )

    # converting the alphas into x and y coordinates using radius as radius*cos(alpha) and radius*sin(alpha) respectively
    single_rpacket_x = (
        (np.array(r_track)) * np.cos(np.array(single_alpha)) * 1e-5 / time
    )
    single_rpacket_y = (
        (np.array(r_track)) * np.sin(np.array(single_alpha)) * 1e-5 / time
    )

    # adding interactions at different steps
    # using the change of slope of the trajectory line at different steps, we determine if an interactions happened or not.

    for step_no in range(len(r_track)):
        # when packet is at its starting and ending point in its trajectory, we consider it as no interaction
        if step_no == 0 or step_no == len(r_track) - 1:
            single_rpacket_interactions.append(0)
        else:
            # current slope is the slope of line from previous position of the packet to the current position
            single_rpacket_interactions.append(last_interaction_type[step_no])

    rpackets_x.append(single_rpacket_x)
    rpackets_y.append(single_rpacket_y)
    rpackets_interactions.append(single_rpacket_interactions)

np_rpackets_x = np.array(rpackets_x, dtype="object")
np_rpackets_y = np.array(rpackets_y, dtype="object")
np_rpackets_interactions = np.array(rpackets_interactions, dtype="object")
Padding Arrays to Uniform Length
[19]:
# Get the maximum number of steps among all packets
rpacket_step_no_array_max_size = max(list(map(len, np_rpackets_x)))

for packet_no in range(len(np_rpackets_x)):
    # making all coordinate arrays of size `rpacket_step_no_array_max_size` by repeating the last element across the remaining length of array
    np_rpackets_x[packet_no] = np.append(
        np_rpackets_x[packet_no],
        np_rpackets_x[packet_no][-1]
        * np.ones(
            [rpacket_step_no_array_max_size - len(np_rpackets_x[packet_no])]
        ),
    )
    np_rpackets_y[packet_no] = np.append(
        np_rpackets_y[packet_no],
        np_rpackets_y[packet_no][-1]
        * np.ones(
            [rpacket_step_no_array_max_size - len(np_rpackets_y[packet_no])]
        ),
    )
    np_rpackets_interactions[packet_no] = np.append(
        np_rpackets_interactions[packet_no],
        np_rpackets_interactions[packet_no][-1]
        * np.ones(
            [
                rpacket_step_no_array_max_size
                - len(np_rpackets_interactions[packet_no])
            ]
        ),
    )
Visualizing Packet Trajectories
Timeline slider
[20]:
slider_steps = [
    {
        **SLIDER_STEP_TEMPLATE,
        "args": [[step_no], SLIDER_STEP_TEMPLATE["args"][1]],
        "label": step_no,
    }
    for step_no in range(rpacket_step_no_array_max_size)
]

slider = {
    **SLIDERS_TEMPLATE,
    "steps": slider_steps,
}
[21]:
fig = go.Figure()
# Set axes properties
label = pu.axis_label_in_latex("Velocity", u.Unit("km/s"), only_text=True)

fig.update_xaxes(
    scaleanchor="y",
    scaleratio=1,
    range=[-1.1 * v_shells[-1], 1.1 * v_shells[-1]],
    title=label,
    **BASE_AXIS_CONFIG,
)

fig.update_yaxes(
    range=[-1.1 * v_shells[-1], 1.1 * v_shells[-1]],
    title=label,
    **BASE_AXIS_CONFIG,
)


# adding the shells and photosphere
for shell_no in range(len(sim.simulation_state.radius.value)):
    shell_radius = v_shells[shell_no]

    # Update only the required attributes
    shape = copy.deepcopy(SHELL_CIRCLE_TEMPLATE)
    shape["x0"] = -1 * shell_radius
    shape["y0"] = -1 * shell_radius
    shape["x1"] = shell_radius
    shape["y1"] = shell_radius
    if shell_no == 0:
        # photosphere
        fig.add_shape(
            **shape,
            line_color=theme_colors[theme]["photosphere_line_color"],
            fillcolor=theme_colors[theme]["photosphere_fillcolor"],
            opacity=1,
        )
    elif shell_no == (len(sim.simulation_state.radius.value) - 1):
        # outermost shell
        fig.add_shape(
            **shape,
            line_color=theme_colors[theme]["shells_line_color"],
            opacity=1,
        )
    else:
        # remaining shells
        fig.add_shape(
            **shape,
            line_color=theme_colors[theme]["shells_line_color"],
            opacity=0.2,
        )


for packet_no in range(len(np_rpackets_x)):
    fig.add_trace(
        go.Scatter(
            x=np_rpackets_x[packet_no],
            y=np_rpackets_y[packet_no],
            mode="markers+lines",
            name="Packet " + str(packet_no + 1),
            showlegend=False,
            hovertemplate=HOVER_TEMPLATE,
            text=[
                interaction_from_num[
                    int(np_rpackets_interactions[packet_no][step_no])
                ]["text"]
                for step_no in range(len(np_rpackets_x[packet_no]))
            ],
            line=dict(color=theme_colors[theme]["packet_line_color"]),
            marker=dict(
                opacity=[
                    interaction_from_num[
                        int(np_rpackets_interactions[packet_no][step_no])
                    ]["opacity"]
                    for step_no in range(len(np_rpackets_x[packet_no]))
                ],
                color=[
                    interaction_from_num[
                        int(np_rpackets_interactions[packet_no][step_no])
                    ]["color"]
                    for step_no in range(len(np_rpackets_x[packet_no]))
                ],
            ),
        )
    )

# adding legends
fig.add_trace(
    go.Scatter(
        **BASE_LEGEND_CONFIG,
        name="e-scattering",
        hoverlabel={"font": {"color": "#222"}},
        marker={"color": "#3366FF"},
        legendgrouptitle={
            "font": {"color": theme_colors[theme]["legendgrouptitle_color"]},
            "text": "Interaction Type:",
        },
    )
)

# Add line interaction trace
fig.add_trace(
    go.Scatter(
        **BASE_LEGEND_CONFIG,
        name="Line Interaction",
        marker={"color": "#FF3300"},
    )
)

# Set figure size
fig.layout.plot_bgcolor = theme_colors[theme]["plot_bgcolor"]
fig.layout.paper_bgcolor = theme_colors[theme]["paper_bgcolor"]

fig.update_layout(
    width=820,
    height=680,
    title="Packet Trajectories",
    title_font_color=theme_colors[theme]["title_font_color"],
    font_color=theme_colors[theme]["font_color"],
    updatemenus=[
        dict(
            type="buttons",
            xanchor="right",
            x=0.1,
            y=0,
            yanchor="top",
            direction="left",
            pad={"r": 10, "t": 87},
            showactive=False,
            bgcolor=theme_colors[theme]["button_bgcolor"],
            bordercolor=theme_colors[theme]["bordercolor"],
            font={"color": theme_colors[theme]["button_font_color"]},
            buttons=BUTTONS,
        )
    ],
)

# adding frames
all_frames = []
for frame in range(rpacket_step_no_array_max_size + 1):
    frame_data = []
    for packet_no in range(len(np_rpackets_x)):
        # adding a scatter object containing the trajectory of a packet upto a particular frame number
        frame_data.append(
            go.Scatter(
                x=np_rpackets_x[packet_no].tolist()[0:frame],
                y=np_rpackets_y[packet_no].tolist()[0:frame],
                mode="markers+lines",
                name="Packet " + str(packet_no + 1),
                showlegend=False,
                hovertemplate=HOVER_TEMPLATE,
                text=[
                    interaction_from_num[
                        int(np_rpackets_interactions[packet_no][step_no])
                    ]["text"]
                    for step_no in range(len(np_rpackets_x[packet_no]))
                ],
                line=dict(color=theme_colors[theme]["packet_line_color"]),
                marker=dict(
                    opacity=[
                        interaction_from_num[
                            int(np_rpackets_interactions[packet_no][step_no])
                        ]["opacity"]
                        for step_no in range(len(np_rpackets_x[packet_no]))
                    ],
                    color=[
                        interaction_from_num[
                            int(np_rpackets_interactions[packet_no][step_no])
                        ]["color"]
                        for step_no in range(len(np_rpackets_x[packet_no]))
                    ],
                ),
            )
        )
    all_frames.append(go.Frame(data=frame_data, name=frame))

fig.frames = all_frames

fig.layout.sliders = [slider]

fig.show(renderer="notebook_connected")