You can interact with this notebook online: Launch notebook
How to Generate Custom Abundance Widget
This notebook demonstrates how to generate and display Custom Abundance Widget.
First, import CustomAbundanceWidget module from visualization subpackage to create the widget.
[1]:
from tardis.visualization import CustomAbundanceWidget
Initializing tabulator and plotly panel extensions for widgets to work
Initialize the GUI
There are four ways to generate the widget. You can generate it from .yml/.csvy configuration files before running any simulation.
Using a YAML file
[2]:
widget = CustomAbundanceWidget.from_yml("tardis_example.yml")
Number of density points larger than number of shells. Assuming inner point irrelevant
model_isotope_time_0 is not set in the configuration. Isotopic mass fractions will not be decayed and is assumed to be correct for the time_explosion. THIS IS NOT RECOMMENDED!
Using a CSVY file
[3]:
# widget = CustomAbundanceWidget.from_csvy("demo.csvy")
Alternatively, you can generate the widget after the simulation from a Simulation instance or a saved simulation (HDF file).
Using a Simulation object
[4]:
# sim = run_tardis("tardis_example.yml")
# widget = CustomAbundanceWidget.from_simulation(sim)
Using a HDF file
[5]:
# widget = CustomAbundanceWidget.from_hdf("demo.h5")
Display the GUI
No matter which way you use to initialize the widget, you can call .display() to display the GUI easily.
[6]:
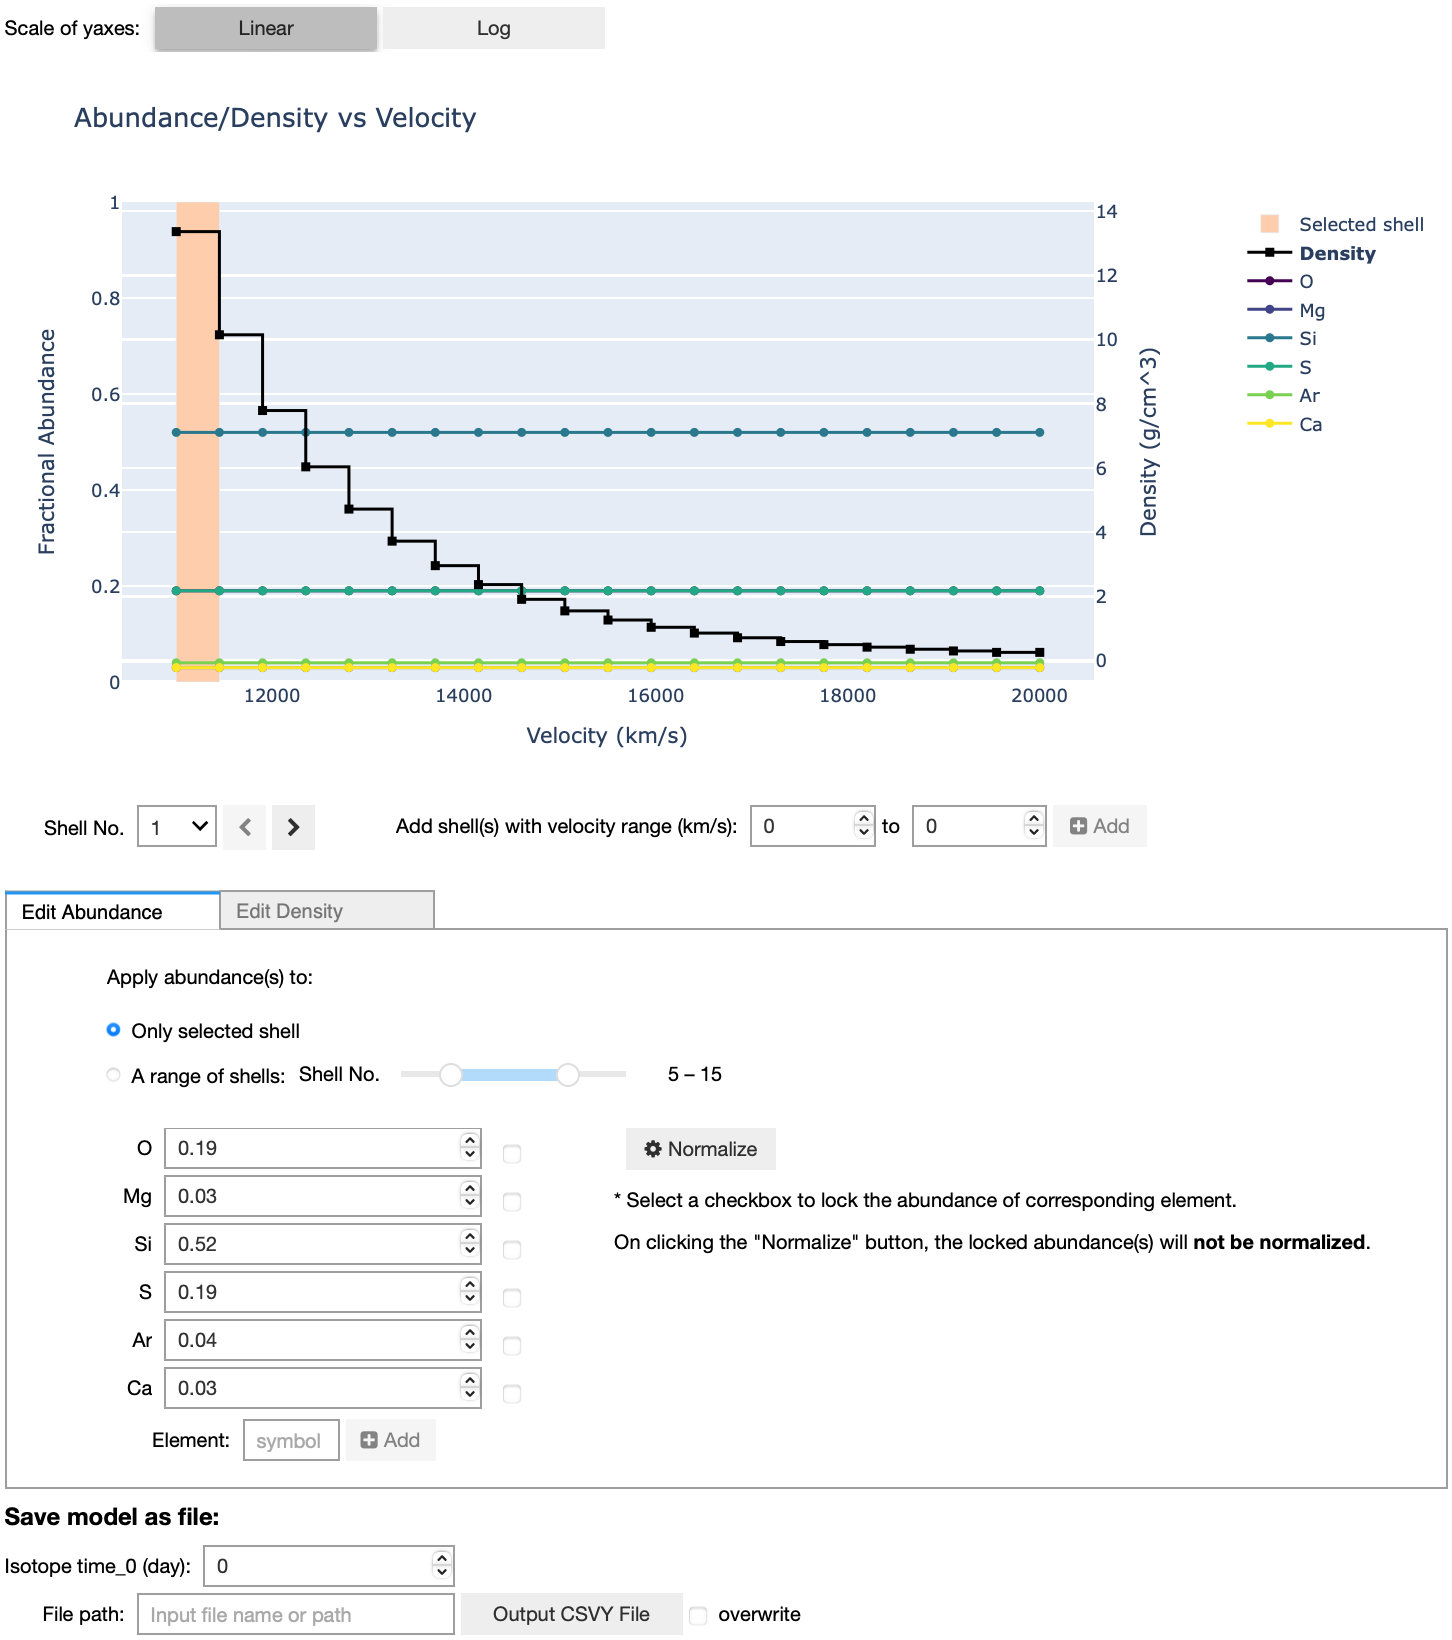
widget.display()
[6]:
The image below is just a screenshot of the GUI for a demonstration purpose. If you want to interact with the GUI, please run the code in the notebook.
[ ]: