You can interact with this notebook online: Launch notebook
How to Generate Custom Abundance Widget
This notebook demonstrates how to generate and display Custom Abundance Widget.
First, import CustomAbundanceWidget module from visualization subpackage to create the widget.
[1]:
from tardis.visualization import CustomAbundanceWidget
Initialize the GUI
There are four ways to generate the widget. You can generate it from .yml/.csvy configuration files before running any simulation.
Using a YAML file
[2]:
widget = CustomAbundanceWidget.from_yml("tardis_example.yml")
Number of density points larger than number of shells. Assuming inner point irrelevant
Using a CSVY file
[3]:
# widget = CustomAbundanceWidget.from_csvy("demo.csvy")
Alternatively, you can generate the widget after the simulation from a Simulation instance or a saved simulation (HDF file).
Using a Simulation object
[4]:
# sim = run_tardis("tardis_example.yml")
# widget = CustomAbundanceWidget.from_simulation(sim)
Using a HDF file
[5]:
# widget = CustomAbundanceWidget.from_hdf("demo.h5")
Display the GUI
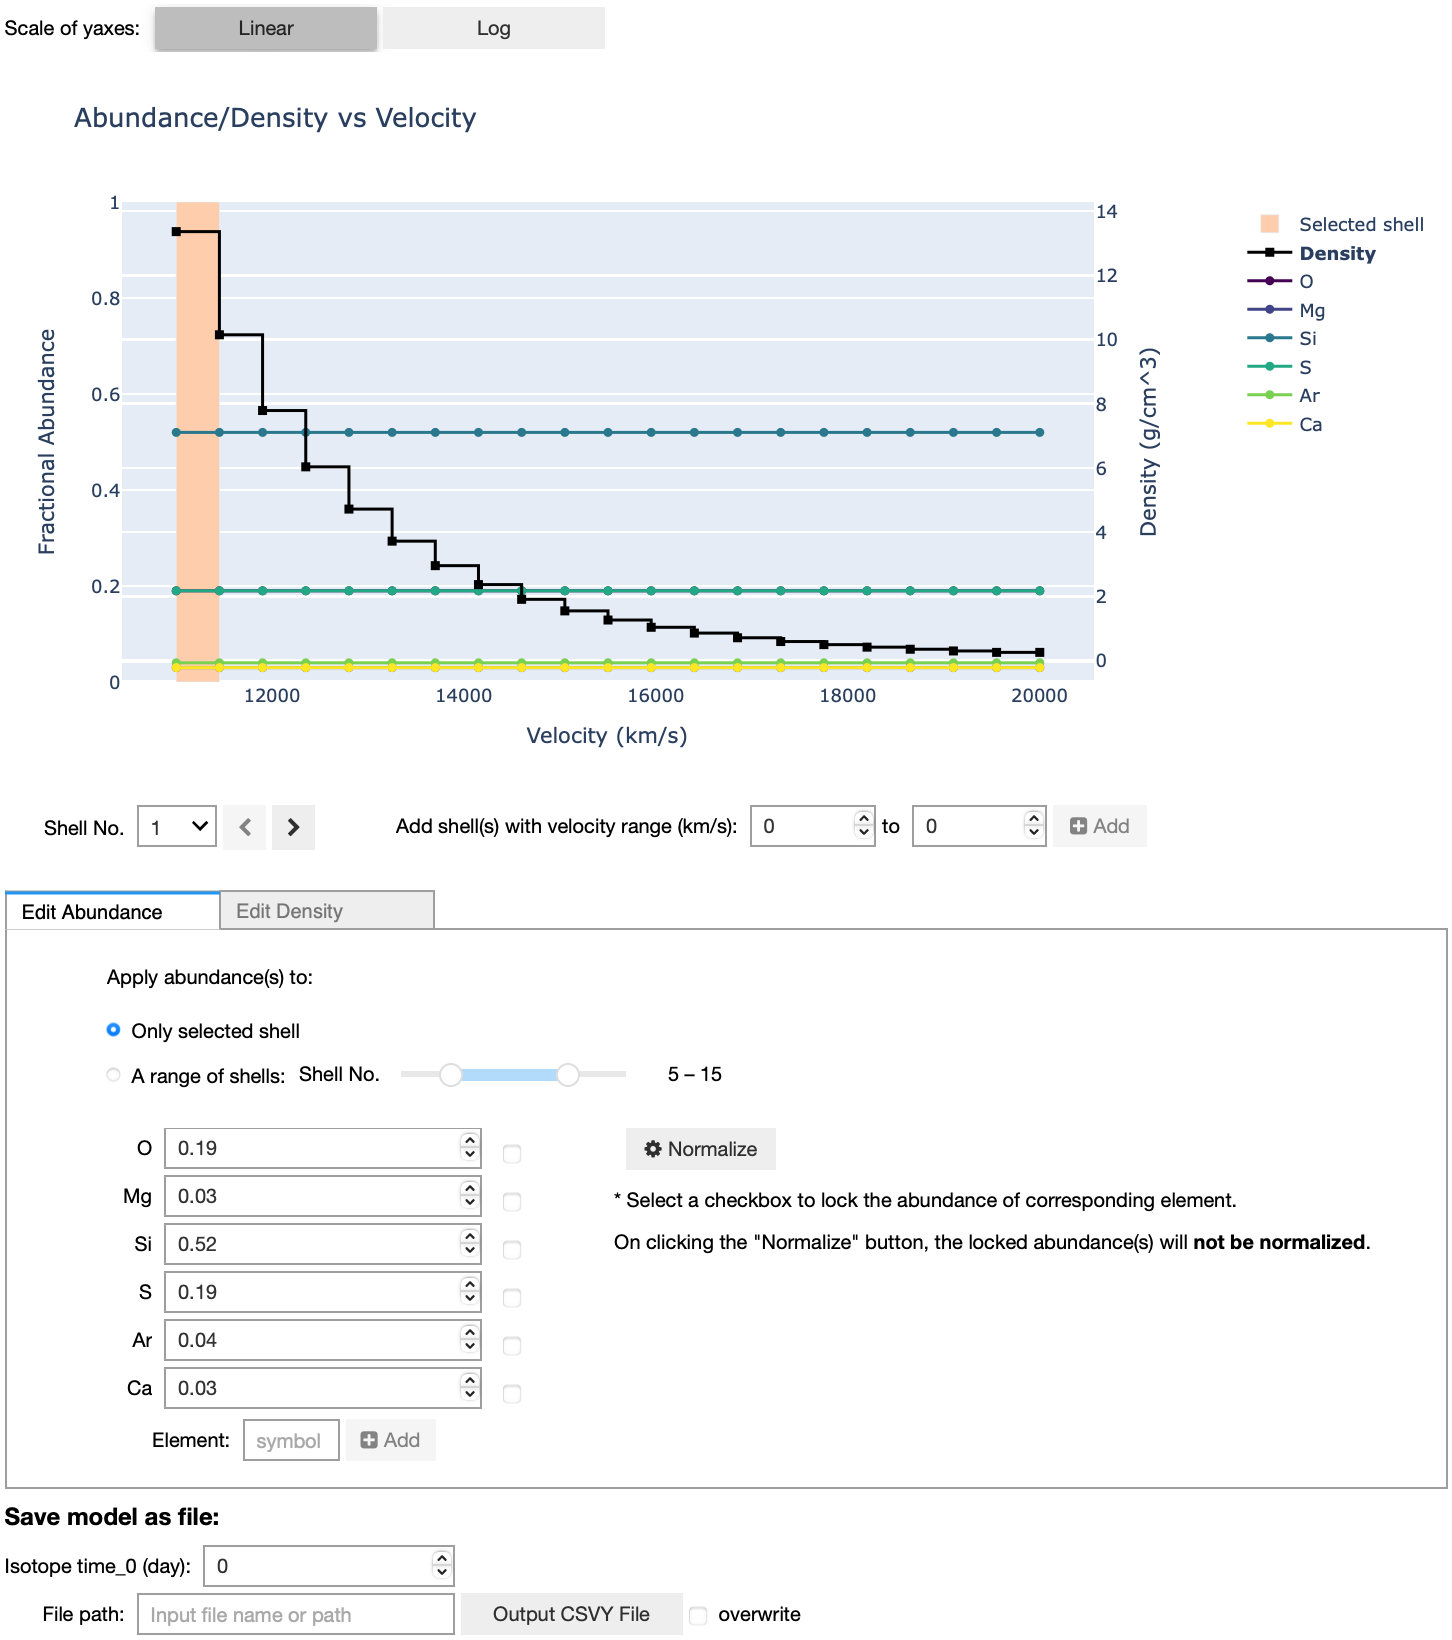
No matter which way you use to initialize the widget, you can call .display() to display the GUI easily.
[6]:
widget.display()
The image below is just a screenshot of the GUI for a demonstration purpose. If you want to interact with the GUI, please run the code in the notebook.
[ ]: