You can interact with this notebook online: Launch notebook
Energy Level Diagram Widget
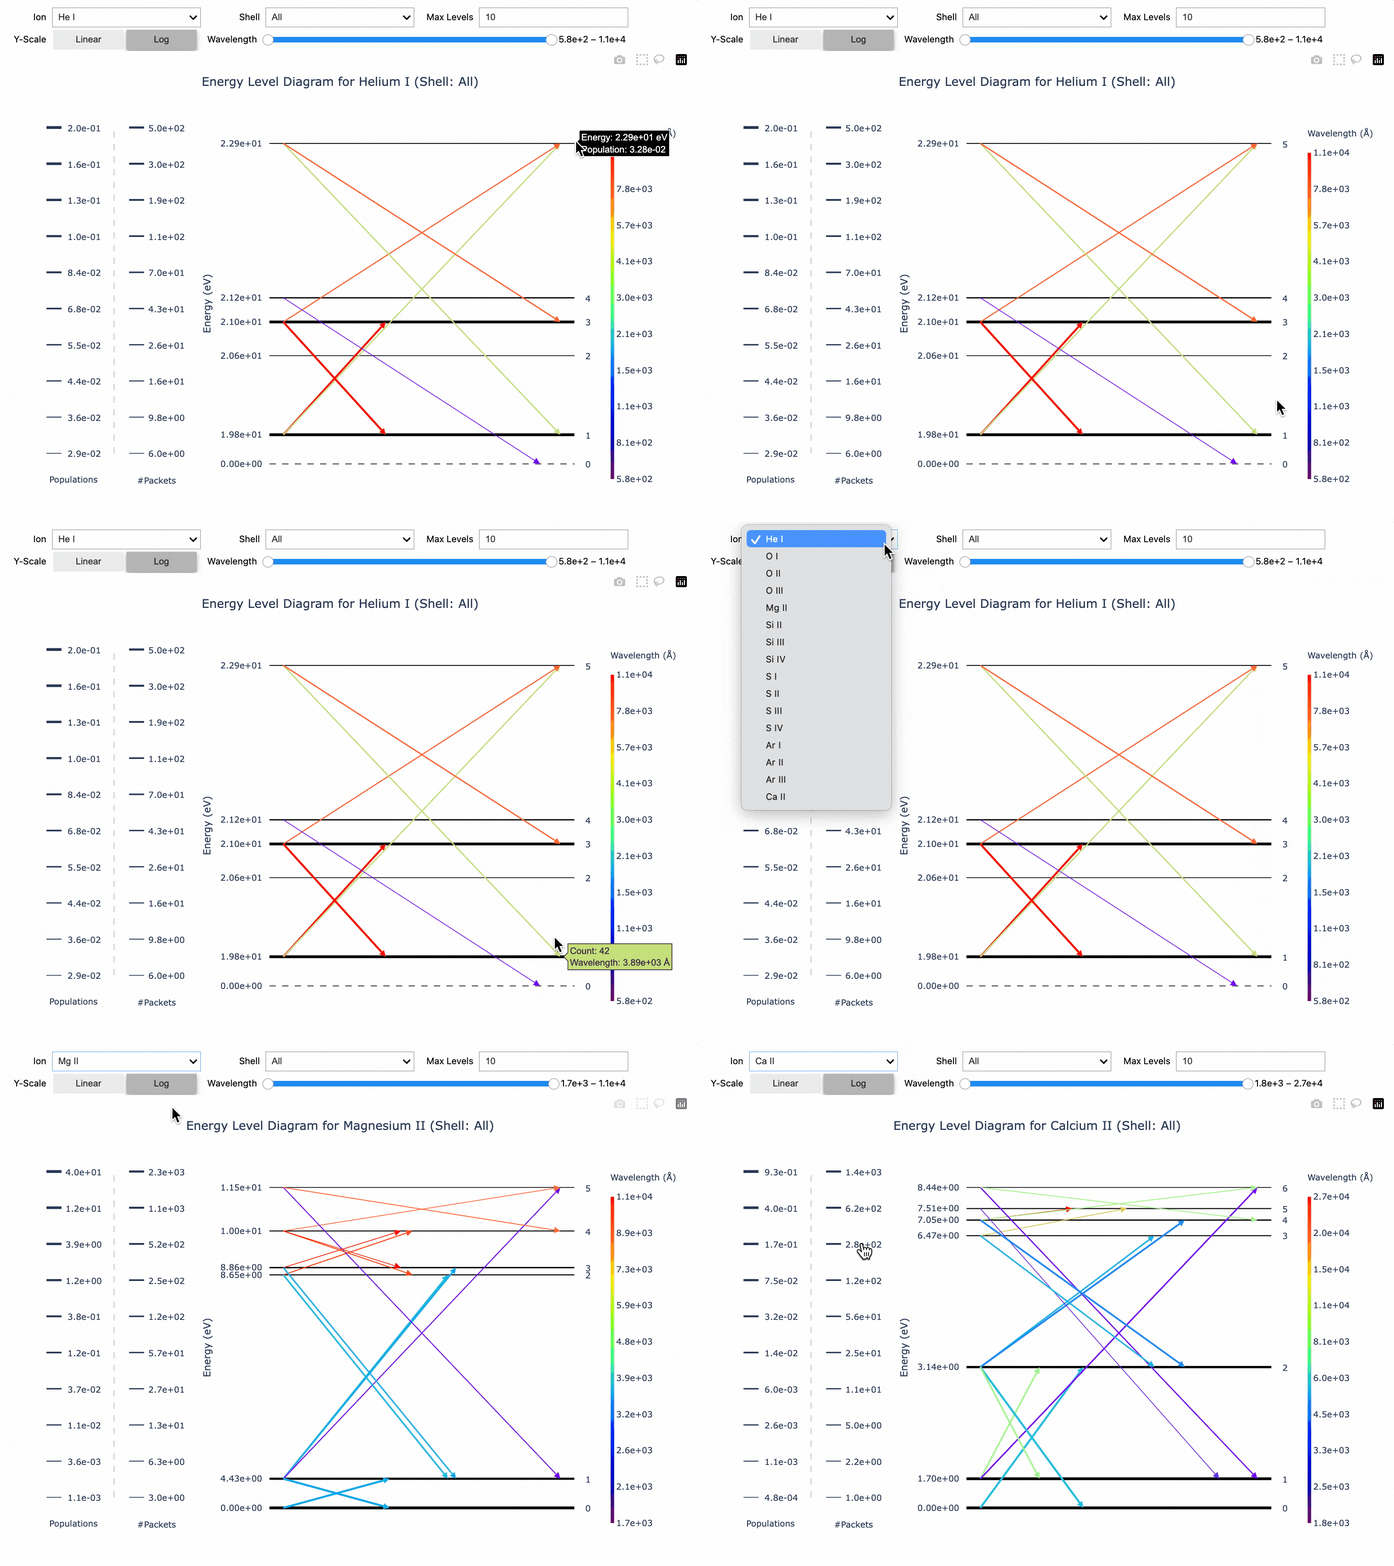
The Energy Level Diagram Widget (also called the Grotrian Widget) lets you visualize the last line interactions in a simulation as an energy level diagram.
By selecting an ion present in the simulation, you can see its energy level diagram along with information about the last line interactions experienced by packets.
The y-axis represents energy.
Horizontal lines show discrete energy levels. The thickness of each line reflects the level population — thicker lines indicate a greater population.
Arrows represent line interactions between levels. Upward arrows show excitation (lower → higher energy) and downward arrows show de-excitation (higher → lower energy). The thickness of each arrow indicates the number of packets that underwent that interaction, and the color encodes the wavelength of the transition.
Interacting with the GUI
You can filter the last line interactions and level populations using several controls:
Wavelength range slider — restrict which transitions are shown.
Shell selector — filter by a specific model shell. If no shell is selected, all last line interactions are plotted and level populations are averaged across all shells.
Maximum number of levels — set how many levels (beginning from the lowest energy) to display on the plot.
Y-axis scale — switch between Linear and Log scaling.
Generating the Widget
First, create and run a simulation (see Quickstart for details), then import GrotrianWidget from the visualization subpackage.
[1]:
from tardis import run_tardis
from tardis.io.atom_data import download_atom_data
from tardis.io.configuration.config_reader import Configuration
from tardis.visualization import GrotrianWidget

# Download the atomic data needed to run the simulation
download_atom_data('kurucz_cd23_chianti_H_He_latest')

config = Configuration.from_yaml("tardis_example.yml")
config.montecarlo.tracking.track_rpacket = True

sim = run_tardis(config, virtual_packet_logging=True)
Initializing tabulator and plotly panel extensions for widgets to work
Atomic Data kurucz_cd23_chianti_H_He_latest already exists in /home/runner/Downloads/tardis-data/kurucz_cd23_chianti_H_He_latest.h5. Will not download - override with force_download=True.
Auto-detected Sphinx build environment
Auto-detected Sphinx build environment
Embedding the final state for Jupyter environments
Note for Documentation Viewers
The interactive widget below will not function in the published documentation. To use this widget, please run this notebook locally in a Jupyter environment with TARDIS installed.
[2]:
energy_level_widget = GrotrianWidget.from_simulation(sim)
energy_level_widget.display()
[py.warnings         ][WARNING]  /home/runner/micromamba/envs/tardis/lib/python3.14/site-packages/pandas/core/arraylike.py:402: RuntimeWarning: divide by zero encountered in log
  result = getattr(ufunc, method)(*inputs, **kwargs)
 (_py_warnings.py:230)
[2]: