You can interact with this notebook online: Launch notebook
Line Info Widget
The Line Info Widget lets you explore the atomic lines responsible for producing features in the simulated spectrum.
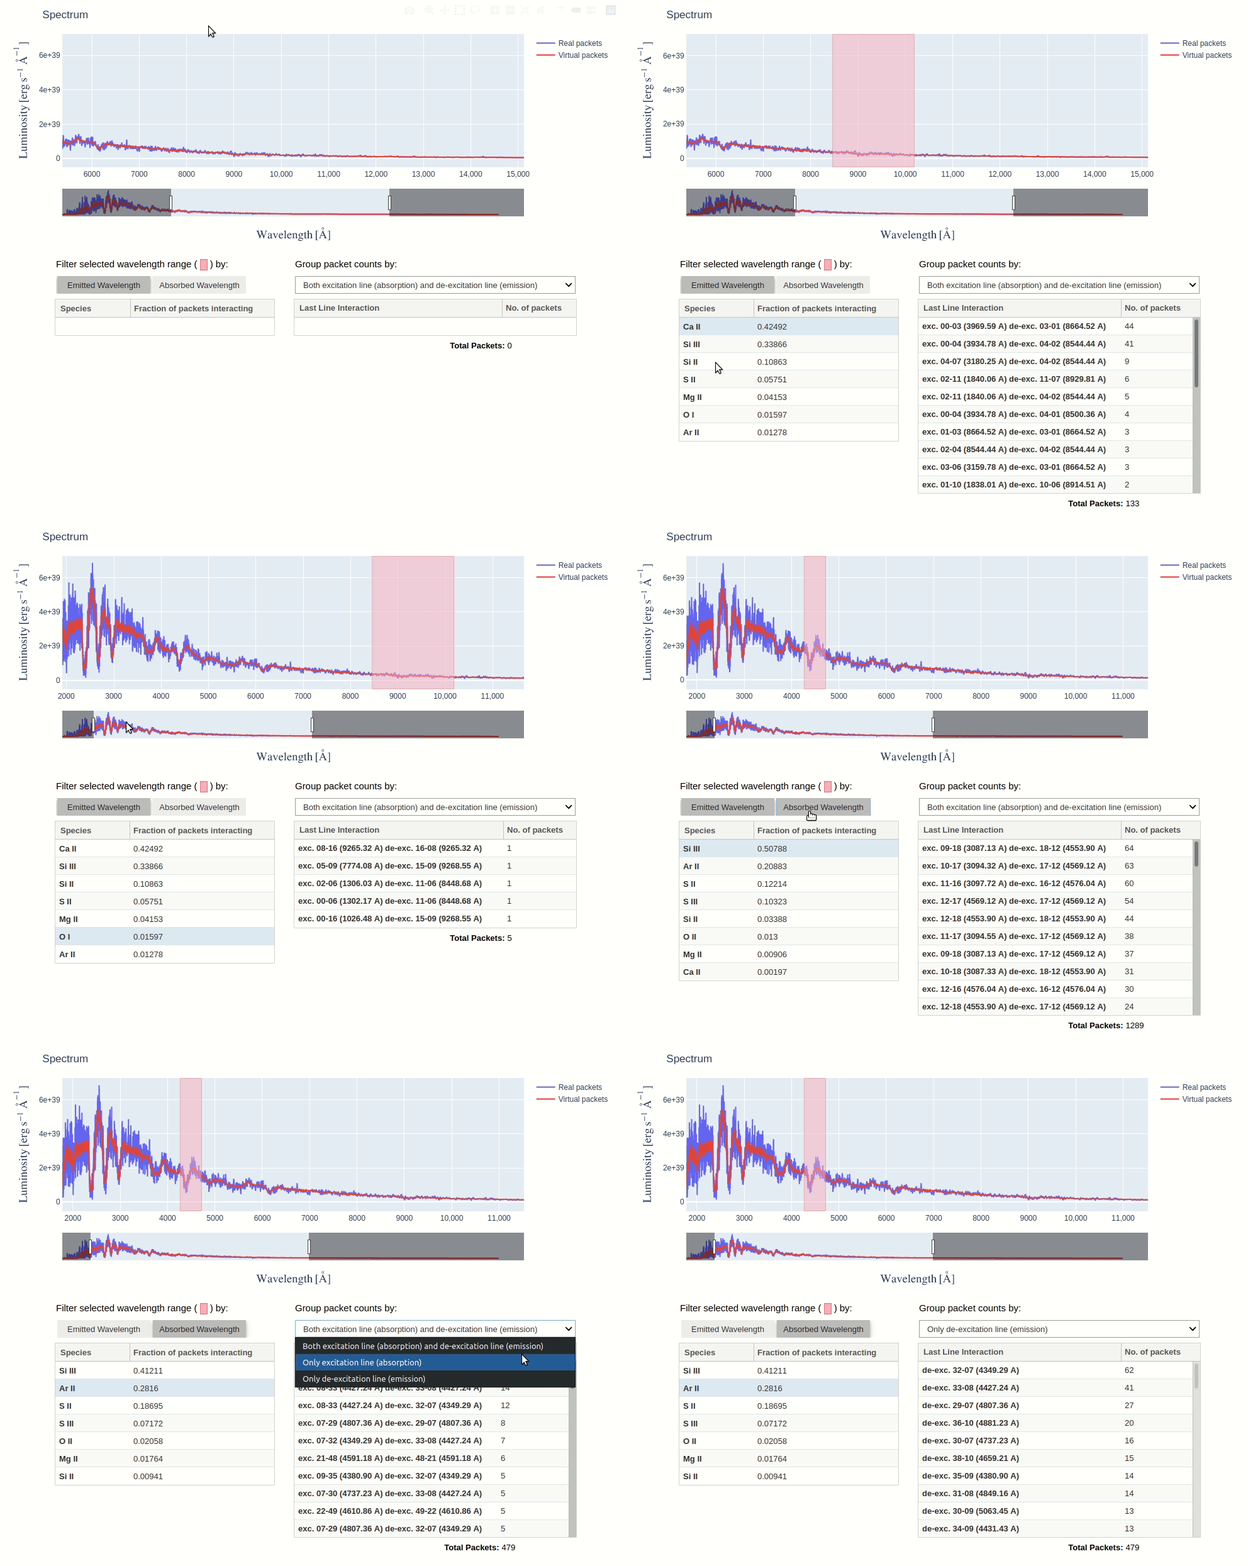
By selecting a wavelength range on the spectrum plot, you can see the species that produced features within that range. This is determined by counting the number of escaping packets that experienced their last interaction with each species. Packets can be filtered by the wavelength at which they were absorbed or emitted, using the toggle buttons.
You can then click on a species to see the packet count for each last line interaction it experienced. Using the dropdown menu, these counts can be grouped by excitation lines, de-excitation lines, or both.
Interacting with the Spectrum
The spectrum in the Line Info Widget is an interactive figure built with plotly. There are several ways to interact with it:
Making a Selection
Box selection is enabled by default. Click and drag on the figure to draw a selection box. The tables will update to show line information for only the packets within that wavelength range. To resize an existing selection box, simply redraw a new one over the older one.
Using Other Options in the Modebar
Moving the mouse to the top right corner of the figure reveals the Modebar. The default option is Box Select (dotted square icon). Other options include Zoom (magnifying glass icon) for a rectangular zoom, and Reset Axes to revert to the initial state. Always click back on Box Select before making wavelength selections.
Generating the Widget
First, create and run a simulation (see Quickstart for details), then import LineInfoWidget from the visualization subpackage.
Note: The virtual packet logging capability must be active to produce the virtual packets’ spectrum. Ensure
virtual_packet_logging: Trueis set in your configuration file under thespectrum.virtualproperty (see configuration schema).
[1]:
from tardis import run_tardis
from tardis.io.atom_data import download_atom_data
from tardis.io.configuration.config_reader import Configuration
from tardis.visualization import LineInfoWidget

# Download the atomic data needed to run the simulation
download_atom_data('kurucz_cd23_chianti_H_He_latest')

config = Configuration.from_yaml("tardis_example.yml")
config.montecarlo.tracking.track_rpacket = True

sim = run_tardis(config, virtual_packet_logging=True)
Initializing tabulator and plotly panel extensions for widgets to work
Atomic Data kurucz_cd23_chianti_H_He_latest already exists in /home/runner/Downloads/tardis-data/kurucz_cd23_chianti_H_He_latest.h5. Will not download - override with force_download=True.
Auto-detected Sphinx build environment
Auto-detected Sphinx build environment
Embedding the final state for Jupyter environments
Note for Documentation Viewers
The interactive widget below will not function in the published documentation. To use this widget, please run this notebook locally in a Jupyter environment with TARDIS installed.
[2]:
line_info_widget = LineInfoWidget.from_simulation(sim)
line_info_widget.display()
[2]:
Line Info Widget with SDEC Plot
The Line Info Widget can also display an SDEC Plot alongside the spectrum. Enable this by passing show_sdec=True when creating the widget. Parameters to customize the SDEC plot can be passed via the sdec_kwargs argument as a dictionary — it accepts the same parameters as SDECPlotter.generate_plot_bk().
[3]:
plot = LineInfoWidget.from_simulation(sim, show_sdec=True, sdec_kwargs={"packets_mode": "real"})
plot.display()
[3]: